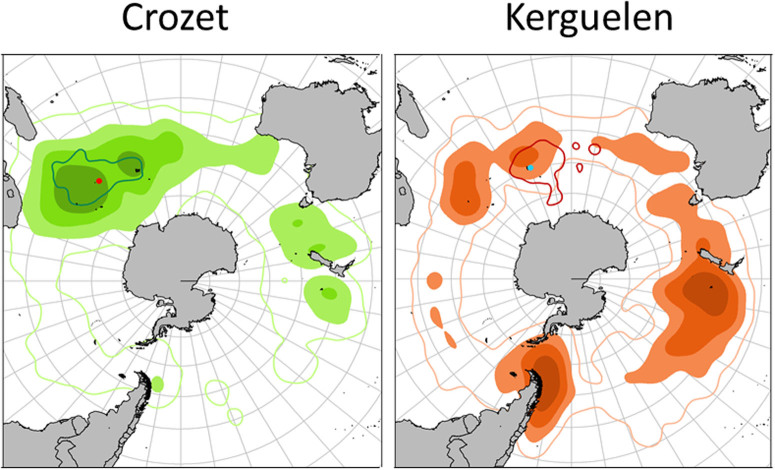
Figure 1. Kernel densities or utilisation distributions (25%, 50% 75% and 95% UDs) of adult wandering albatrosses tracked during the sabbatical year from Crozet (red dot) and Kerguelen (blue dot).
The 95% UD of breeding birds is indicated by the solid line for each population (Figures produced from R software).

