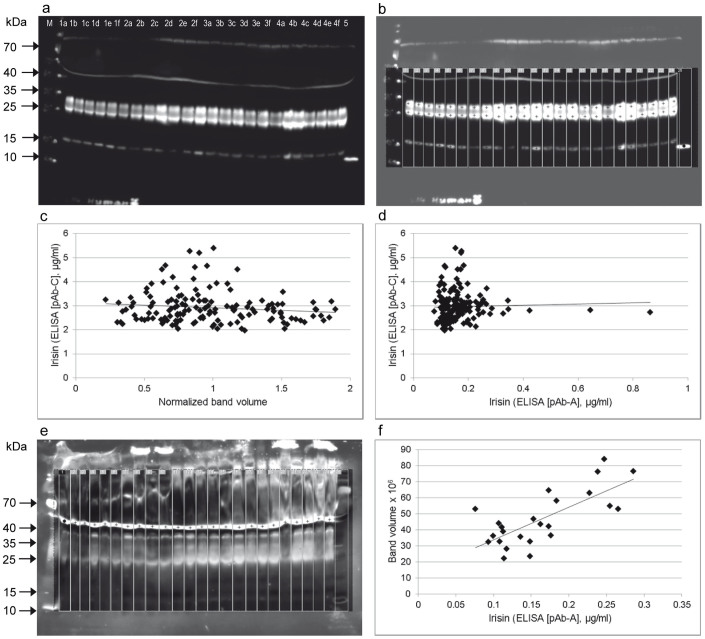
Figure 4. Semi-quantitative analysis of western blots with pAb-C and comparison with ELISA data (based on pAb-A and pAb-C).
(a) Western blot (pAb-C) of serum samples of 4 individuals (lanes 1–4) at 6 time points (lanes a–f). RNG-irisin was included as positive control (lane 5). The image was taken after 10 min exposure. (b) Quantification of chemiluminescence of targeted bands (crosses) in marked lanes. Note that contrast enhancement in the region of measurement is only for visualization and does not influence the results. This measurement was done in all 156 samples from 26 individuals of a previous study13. (c) Plot of normalized, combined band volumes against irisin levels measured with ELISA based on pAb-C. (d) Plot of irisin levels measured with ELISA based on pAb-A against ELISA based on pAb-C. (e) Quantification of a band (crosses) at 50 kDa detected by western blot of human serum samples with pAB-A. Samples were arbitrarily chosen from the previous study13. (f) Volume of the non-specific 50 kDa band was plotted against irisin concentration measured with ELISA based on pAb-A.

