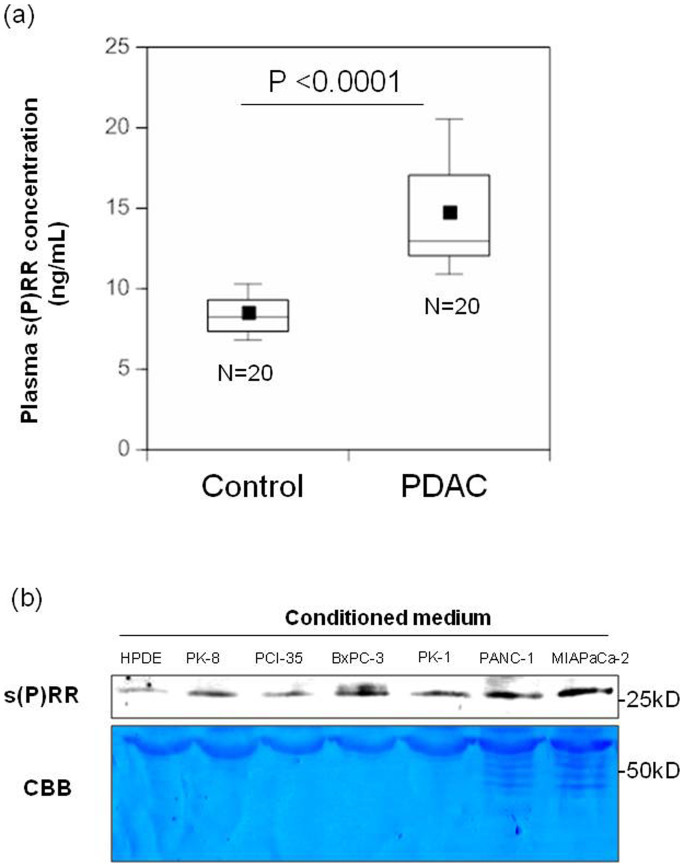
Figure 1. Plasma s(P)RR levels in patients with PDAC and amounts in the conditioned medium of human PDAC cell lines.
(a) Plasma s(P)RR levels in 20 patients with PDAC and 20 healthy matched controls. Data are mean ± SD values. The boxes encompass the twenty-fifth through seventy-fifth percentiles of results. The lines through the middle of each box represent the medians. The maximum and minimum values within 1.5 × interquartile range (IQR) are shown as whisker caps. Average values are indicated by dots in the boxes. (b) s(P)RR in conditioned medium was assayed for HPDE cells and six different PDAC cell lines. Consistent results were observed when three experiments were repeated. Loading control was determined by CBB staining.

