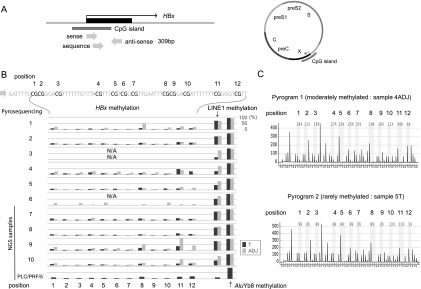
Figure 1.

Methylation analysis of the CGI of the HBx gene. (A) Schema of the CGI of the HBx gene. Three arrows show the pyrosequencing primers used for the methylation analysis. (B) DNA methylation levels of the CpGs of the HBx gene, LINE1, and AluYb8 in 10 paired HBV-HCC and adjacent nontumor tissue samples and PLC/PRF/5 DNA were analyzed using bisulfite pyrosequencing. Methylation levels of HBx varied across samples and were generally lower in HCC tissues than in the adjacent nontumor tissues. An association between HBx methylation levels and those of the LINE1 and AluYb8 repeats was not observed. N/A, could not be analyzed. DNAs from four paired HBV-HCC and adjacent nontumor tissue samples (sample nos. 7–10), PLC/PRF5, and HepG2.2.15 were further analyzed using the NGS (G-NaVI method). (C) Representative pyrograms showing DNA methylation levels of the CpGs of the HBx gene. Methylation levels at 12 CpG sites of the HBx gene in adjacent nontumor tissue (sample no. 4ADJ) and tumor tissue (sample no. 5T) are shown.
