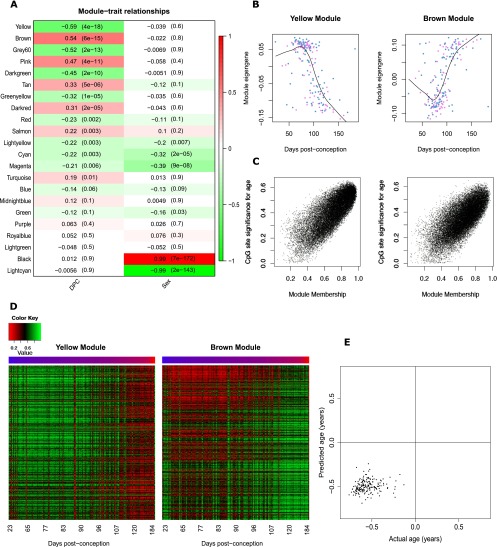
Figure 4.
Gene comethylation modules in the developing human brain. (A) Heatmap representing the correlation between module eigenvalues (ME) and the samples traits of DPC and sex. Each row represents a module, as indicated on the y-axis, and each column a trait. As shown in the color scale bar, strong positive correlation is indicated by dark red, strong negative correlation is indicated by dark green, and white indicates no correlation. Each cell contains the corresponding correlation and P-value given in parentheses. The yellow (P = 3.94 × 10⁻¹⁸) and brown (P = 5.63 × 10⁻¹⁵) WCGNA modules are most significantly associated with human fetal brain development. (B) The module eigengene of the yellow and brown modules is significantly associated with brain development, and (C) module membership in both modules is strongly correlated with probe significance with brain development (yellow module: r = 0.79, P < 1 × 10−200; brown module: r = 0.72, P < 1 × 10−200). Probe significance is the absolute value of the correlation between DNA methylation at a CpG site and developmental age, and module membership is defined as the correlation between the module eigengene and the probe methylation profile. (D) Heatmap of probes in the yellow and brown modules showing changes across brain development. Color corresponds to DNA methylation level at probes with a module membership >0.85. (E) There is a significant correlation (r = 0.15, P = 0.038) between predicted and actual age at the resolution of days.

