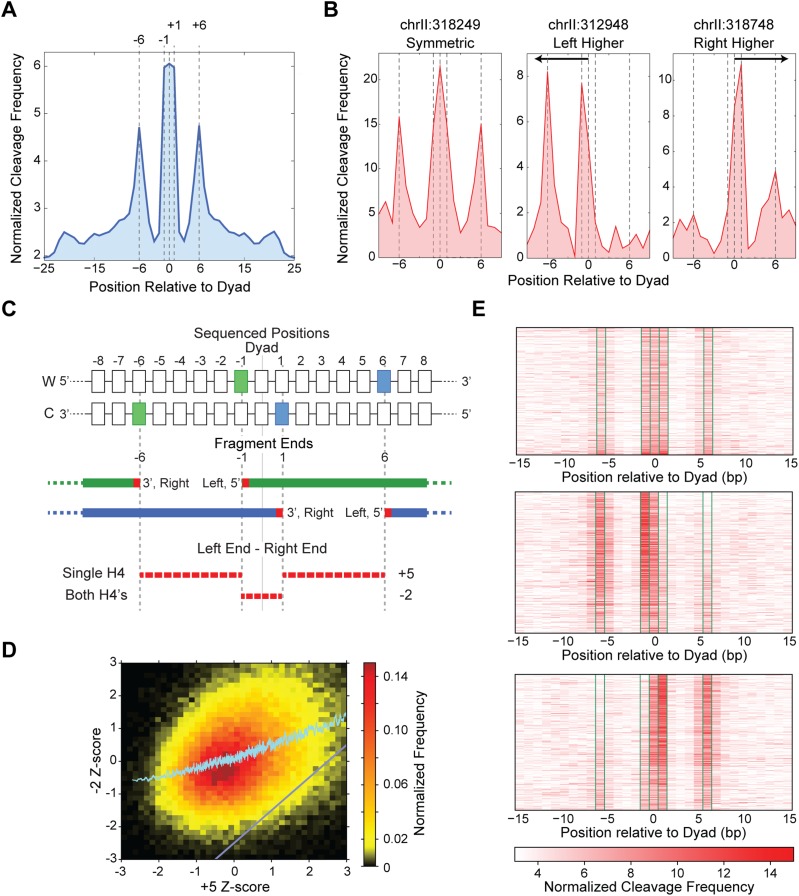
Figure 1.
H4S47C-anchored cleavage mapping identifies asymmetric nucleosomes. (A) The cleavage data, when averaged over all nucleosomes genome-wide, reveals specific peaks at −6, −1, 0, +1, and +6 bp positions relative to the dyad axis. Dyad axis positions were obtained from Brogaard et al. (2012a). (B) Cleavage signal over single nucleosome dyad axis positions showing a symmetric nucleosome (left), asymmetric nucleosomes with higher signal upstream of the dyad (center) and downstream from the dyad (right). (C) Schematic showing the left and right ends of sequenced fragments that give rise to the specific peaks around the dyad. Cleavages by a single H4 are separated by 5 bp, while cleavages by both the H4s are separated by −2 bp. (D) The −2-ntd Z-score increases monotonically with increasing +5-ntd Z-score. The region below the gray diagonal represents nucleosomes that have a much lower −2-ntd Z-score compared to the +5-ntd Z-score. (E) Heatmap of cleavage mapping data of 1500 symmetric nucleosomes (top), 1654 asymmetric nucleosomes with more cleavages on the left (middle), and 1585 asymmetric nucleosomes with more cleavages on the right side of the dyad (bottom). Significantly more cleavages at −1 and −6 positions compared to +1 and +6 positions in the middle panel and vice versa in the bottom illustrates asymmetry.

