Figure 3.
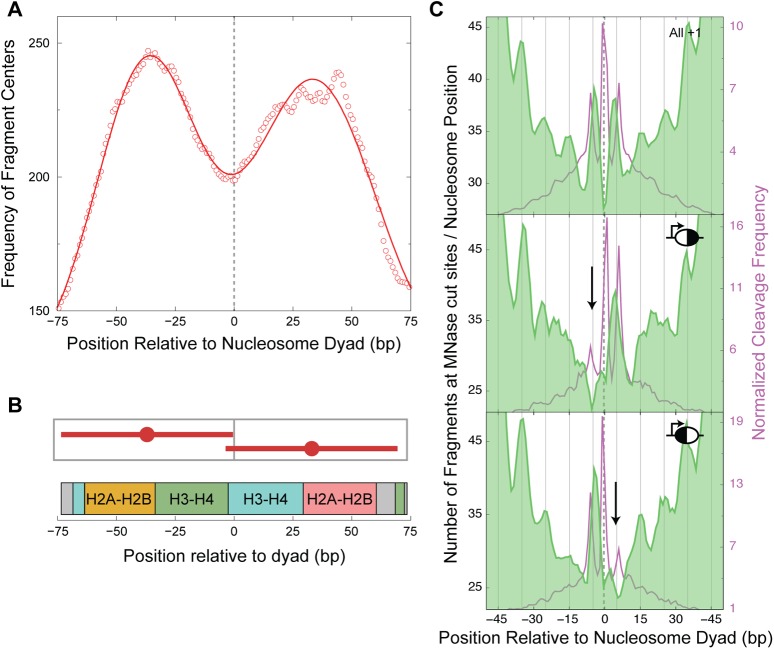
Asymmetric nucleosomes are asymmetrically accessible to MNase. (A) Distribution of the centers of ∼73-bp fragments plotted relative to the +1 dyad axis. A 20-bp running average shows a bimodal distribution with peaks at −37 and +33 bp relative to the dyad, overlaid with its Gaussian fit (solid line). (B) Graphic depicting the fragments that constitute the mean positions obtained from the Gaussian fit, shown in the context of histone-DNA contacts along the path of DNA around the octamer. (C) Distribution of MNase cuts, plotted relative to the nucleosome dyad for all +1 nucleosomes (top, n = 4116) reveals specific cuts at 5 bp on either side of the dyad. A similar distribution of MNase cuts is plotted for asymmetric nucleosomes that have higher cleavages on the downstream side of the dyad with respect to the TSS (middle, n = 171) and for asymmetric nucleosomes that have higher cleavages on the upstream side of the dyad with respect to the TSS (bottom, n = 236). The H4S47C cleavage frequency of each group of nucleosome positions is plotted in the background of their corresponding MNase plots. All nucleosomes are oriented toward the direction of transcription, and the dyad axis position is marked with a dashed line. The downward arrows locate the missing peaks in the asymmetric nucleosomes. The 10-bp periodicity in the MNase peaks can be tracked with the vertical lines that are spaced 10 bp apart.

