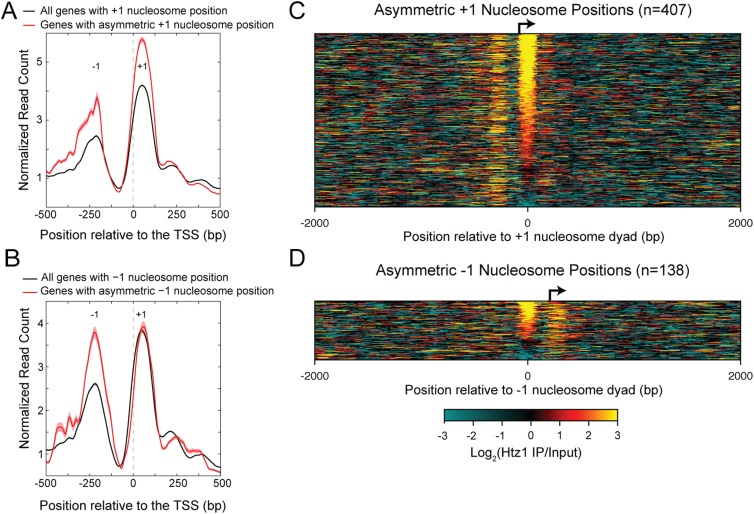
Figure 5.
Genes with asymmetric nucleosome positions are enriched for nucleosomes containing H2A.Z. (A) Genes with asymmetric +1 nucleosome positions are enriched for H2A.Z at the +1 position to a greater extent on average than are all genes. (B) Same as A for genes with asymmetric −1 nucleosome positions. Data are averaged over a 20-bp sliding window. (C) Heatmap of the log2 enrichment of the H2A.Z IP over input, plotted relative to the dyad axis of asymmetric +1 nucleosome positions. (D) Same as C for asymmetric −1 nucleosome positions.

