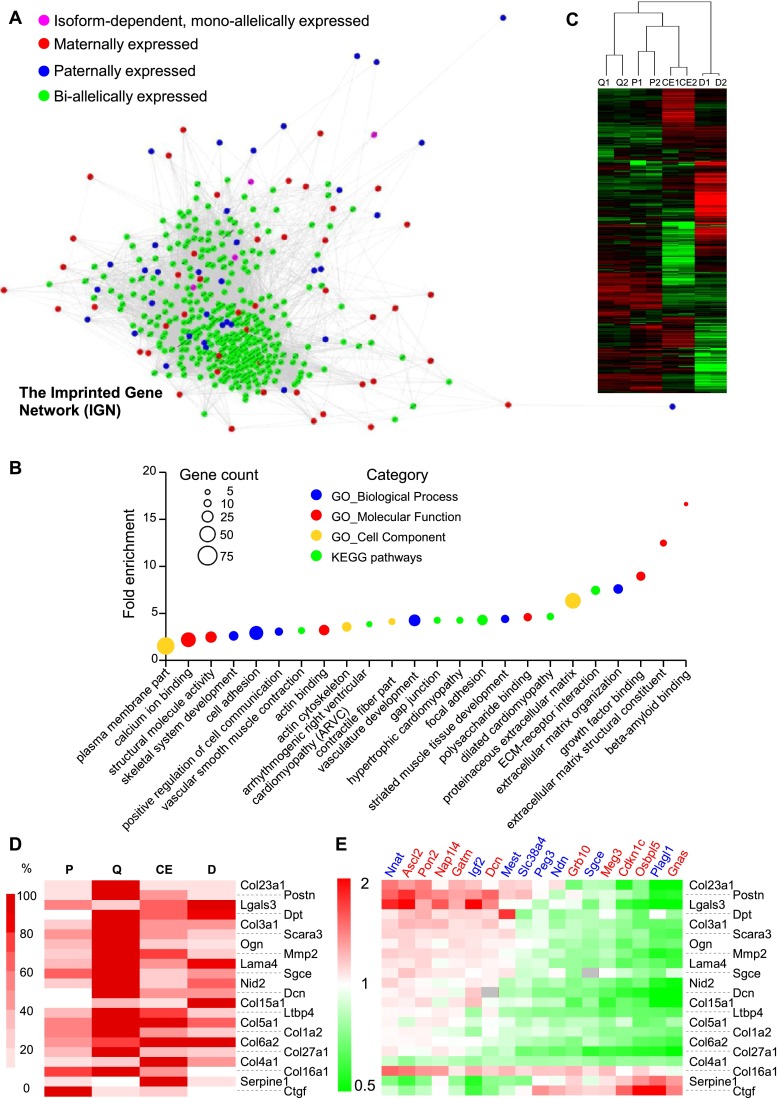
Figure 6.
The murine imprinted gene network (IGN). (A) Biallelically expressed genes coexpressed with murine IGs were retrieved from COXPRESdb and Gemma. Coexpression links among genes present in the intersection of the two lists (for details, see Supplemental Information) were retrieved from COXPRESdb and represented using Cytoscape. Node size and edge width do not map numerical data. (B) GO terms and KEGG pathways enriched in the set of genes represented in Figure 6A. The fold enrichment is displayed for GO terms/KEGG pathways with Benjamini-Hochberg–corrected P-values < 0.05. The size of each dot is proportional to the number of genes associated with the corresponding GO term/KEGG pathway. (C) Hierarchical clustering of transcriptome data from 3T3-L1 preadipocytes. The transcriptome of two independent cultures of 3T3-L1 cells during exponential growth (P; 48 h prior confluence), quiescence (Q; 48 h post-confluence), the clonal expansion phase (CE; 10 h following addition of IDX), and in the differentiated state (D; 6 d following addition of IDX) was determined using RNA-seq. (D) Heatmap of normalized RNA-seq counts for selected ECM genes. (E) Effect of IG overexpression on ECM gene expression. Complementary DNAs encoding CAT or various IGs were transfected in exponentially growing 3T3-L1 cells. Three days post-transfection, the ECM genes were quantified using real-time PCR, and the ratio to the expression levels in the control condition (CAT) was calculated for each IG and represented as a heatmap. Dcn and Sgce are imprinted ECM genes whose expression levels are not displayed (gray boxes) in the corresponding transfected cells.

