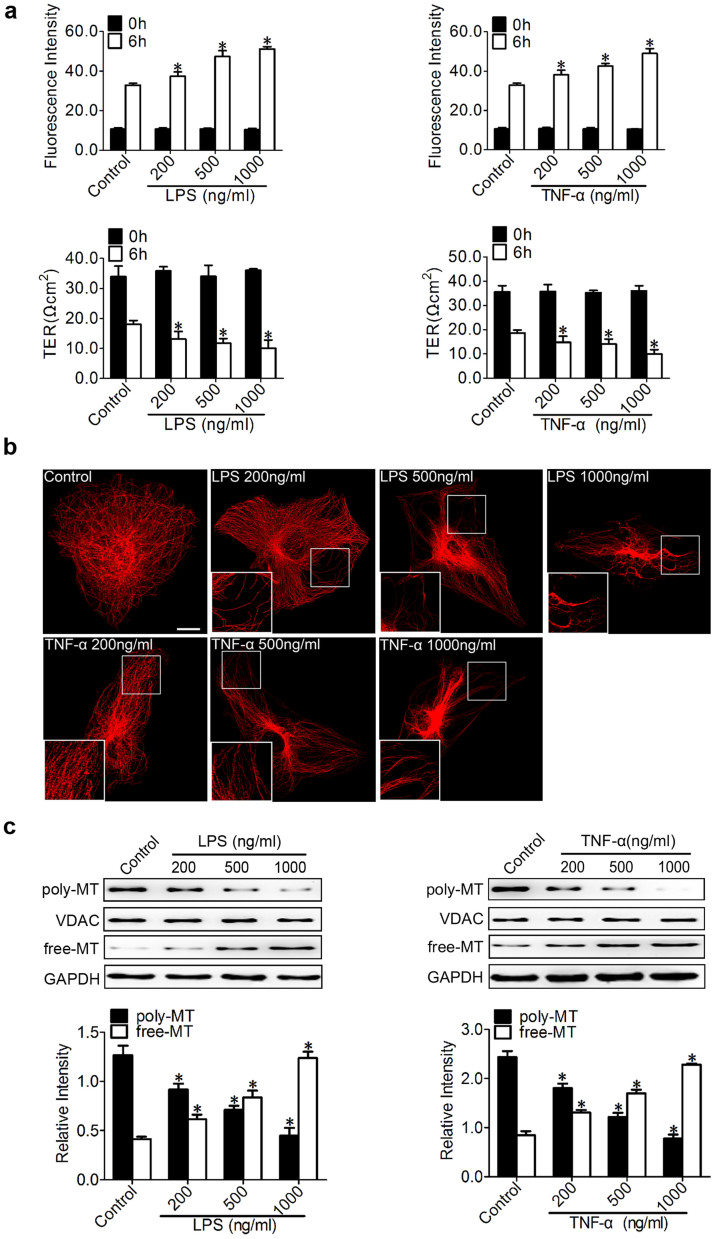
Figure 1. Inflammation-induced endothelial barrier dysfunction and MT disassembly.
(a) The permeability of endothelial cells was assessed by measuring the influx of FITC-conjugated dextran and the transendothelial electrical resistance (TER) across the cells at 0 and 6 hr after treatment with 200, 500, and 1000 ng/ml LPS or TNF-α. The data are represented as the mean ± SEM (n = 3). *P < 0.05 vs. control group. (b) Representative confocal immunofluorescence images showing the microtubules (MTs) organisation of the control cells and the cells after treatment with 200, 500, and 1000 ng/ml of LPS or TNF-α. Bar, 10 μm. The inserts show high-magnification images of the peripheral MT network. (c) Western blot analysis was performed to detect poly/free tubulin after 6 hr of treatment with 200, 500, and 1000 ng/ml LPS or TNF-α. VDAC and GAPDH were used as the marker proteins for polymerised tubulin and free tubulin, respectively. The data are represented as the mean ± SEM (n = 3). *P < 0.05 vs. the control group.

