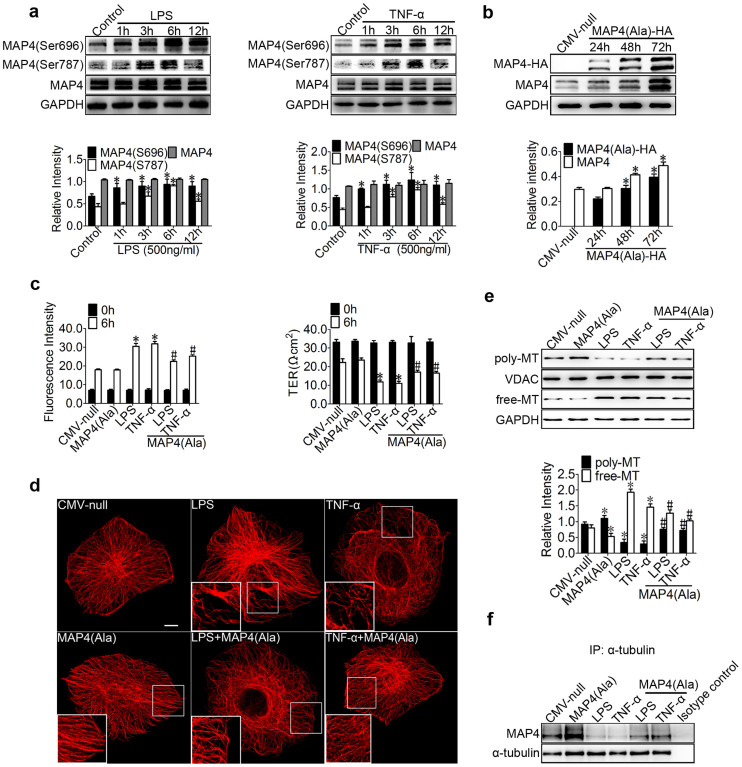
Figure 3. LPS- and TNF-α-induced MAP4 phosphorylation and its effect on endothelial barrier function and MTs.
(a) HPMECs were treated with LPS or TNF-α (500 ng/ml) for 1, 3, 6, and 12 hr and examined using Western blotting. The graph shows the mean ± SEM (n = 3). *P < 0.05 vs. the control. (b) Confirmation of MAP4 (Ala) transfection at comparable levels in HPMECs. (c) The permeability of endothelial cells was assessed by measuring the influx of FITC-conjugated dextran and the TER. The graph shows the mean ± SEM (n = 3). *P < 0.05 vs. CMV-null; #P < 0.05 vs. the LPS or TNF-α group. (d) For the immunofluorescence confocal micrographs, all the cells were transfected with CMV-null or MAP4 (Ala) and then treated or untreated with LPS or TNF-α for 6 hr. Bar, 10 μm. The inserts show high-magnification images of the peripheral MT network. (e) Cells were treated with LPS or TNF-α after being transfected with CMV-null or MAP4 (Ala). The Western blot shows polymerised and free tubulin; VDAC and GAPDH were used as the marker proteins. The graph shows the mean ± SEM (n = 3). *P < 0.05 vs. CMV-null; #P < 0.05 vs. the MAP4 (Ala), LPS, or TNF-α group. (f) Determination of MAP4 binding to tubulin in cells with or without CMV-null or MAP4 (Ala) overexpression under LPS or TNF-α treatment by IP; Isotype control is as the negative control (n = 3).

