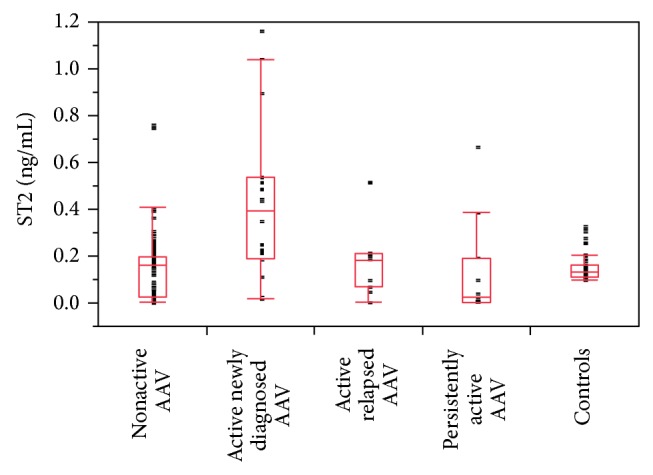
Figure 1.

Comparison of sST2 levels in AAV patients with different disease activity stages and controls. ST2 levels were higher in active newly diagnosed AAV versus nonactive AAV (P < 0.001), persistently active AAV: P < 0.001, and controls (P < 0.01). No other significant differences were found. Box plot graph: boxes represent 25–75 percentile (50% of results in the box = interquartile range (IQR), bottom is the first quartile, top is the third quartile, and median is represented by the line). Whiskers are lines extending vertically from the boxes, which indicate variability outside the upper and lower quartiles. Results which are not included between the whiskers are plotted as an outlier with a dot.
