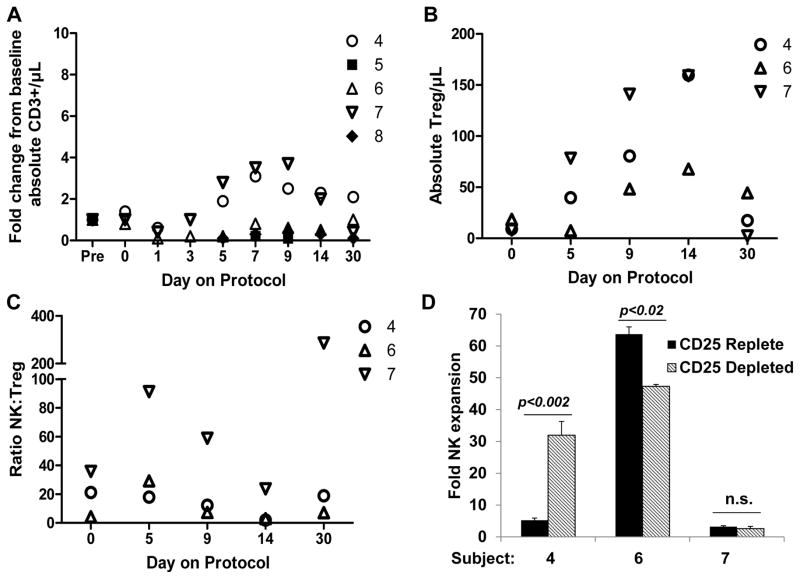
Figure 6. Changes in T cell and T reg cell frequency.
Markers are open for auto-NK cell recipients and closed for allo-NK cell recipients. A. Shown is the fold T cell change from the pre-chemotherapy value for the indicated subjects. B. The frequency of T reg cells was determined for subjects with sufficient circulating T cells (auto-NK cell recipients who did not receive immunosuppression). CD3+CD4+CD25+Foxp3+ T reg cells increased during the IL2 course, peaking at day 14. C. The NK:T reg ratio was higher than day 0 at days 5, 9, and 30 but not on day 14 when T reg levels had peaked and NK cell levels had begun to decrease. D. PBMC obtained from time points in which T reg cell levels were increased from baseline (post NK infusion days 9 or 14) were thawed and then whole PBMC (CD25 replete) and PBMC depleted of CD25+ cells using anti-CD25 antibody-coated magnetic beads were stimulated with irradiated K562-mb15-41BBL cells in the presence of IL2 (300 U/mL). NK cells were enumerated 10 days later by multiplying the viable cell count in the cultures by the NK cell percentage as determined by flow cytometry. Five replicate expansion cultures were set up for each condition. The mean ± the standard deviation is shown in addition to significance values; n.s., not significant.

