Figure 1.

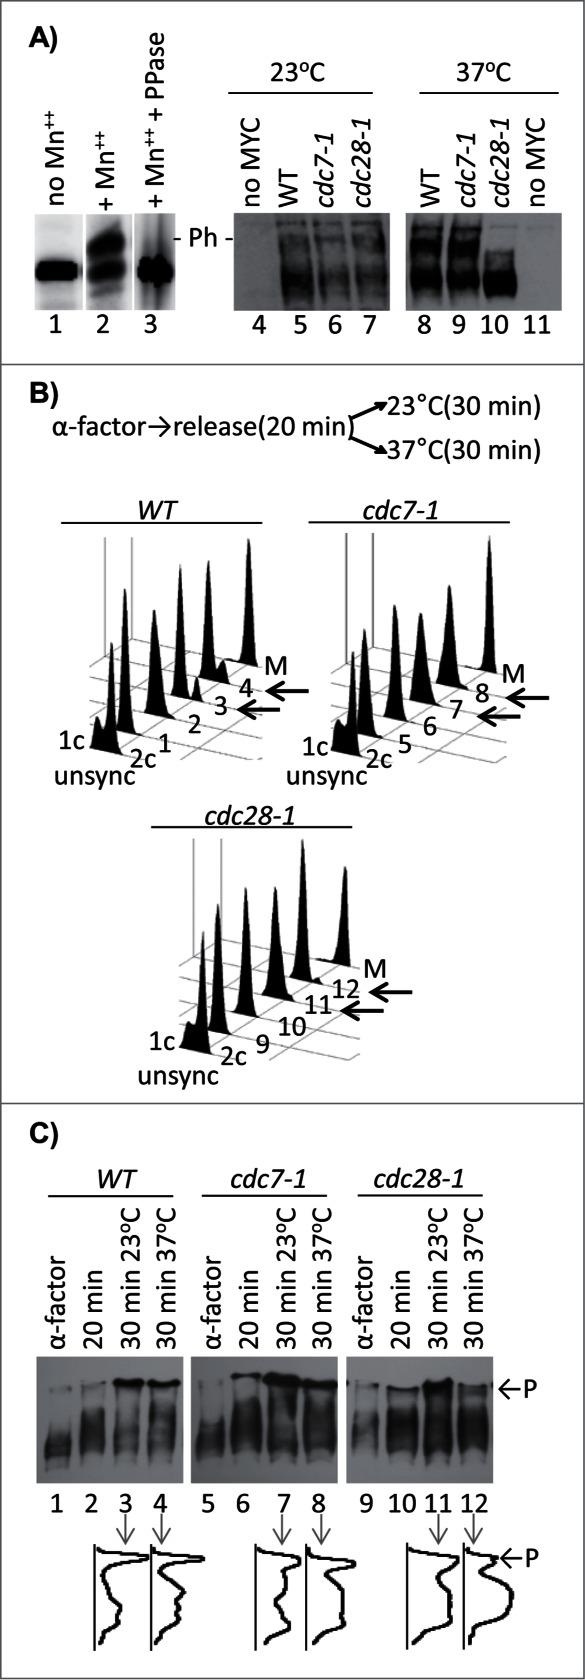
Phosphorylation of Cac1p in cdc7–1 and cdc28–1 mutants. (A) Cac1p-MYC18 was immunoprecipitated from wild type (W303) cell extracts. The samples were treated without (lanes 1, 2) or with lambda phosphatase (lane 3) and run on separate 6.5% SDS-50 μM PhosTagTM-polyacrylamide gels containing or not 100 μM MnCl2 as indicated. In the left-hand panel the cells shown above the lanes were grown at 23°C (lanes 4–7) and then shifted to 37°C for one hour (lanes 8–11) before extracts were prepared by boiling in Laemmli buffer. All samples were analyzed Western blotting with anti-MYC antibody. “- P-” indicates the mobility of the phosphorylated Cac1p-MYC. One of 3 independent experiments is shown. (B) Cells were arrested with α-factor for 3 hours at 23°C, moved to fresh YPD medium for 20 min and then split and grown for 30 min at 23°C and 37°C, respectively. Samples were taken out at the indicated times and analyzed by FACS. Cells arrested in M-phase with Nocodazole (M) show 2c content. Numbers 1–12 indicate the samples corresponding to the lanes in C. Left-pointing arrows highlight the 23°C and 37°C 30 min samples for comparison. (C) Samples were taken out from the cultures at the indicated time points after α-factor arrest, separated in SDS-7.5% polyacrylamide gels containing 60 μM PhosTagTM and 120 μM ZnCl2 and analyzed by Western blotting. Densitometry graphs of lanes 3, 4, 7, 8, 11, 12 were acquired with ImageJ and are shown underneath the lanes. P and arrows indicate the phosphorylated Cac1p-MYC. One of 2 independent experiments with reproducible outcomes is shown.
