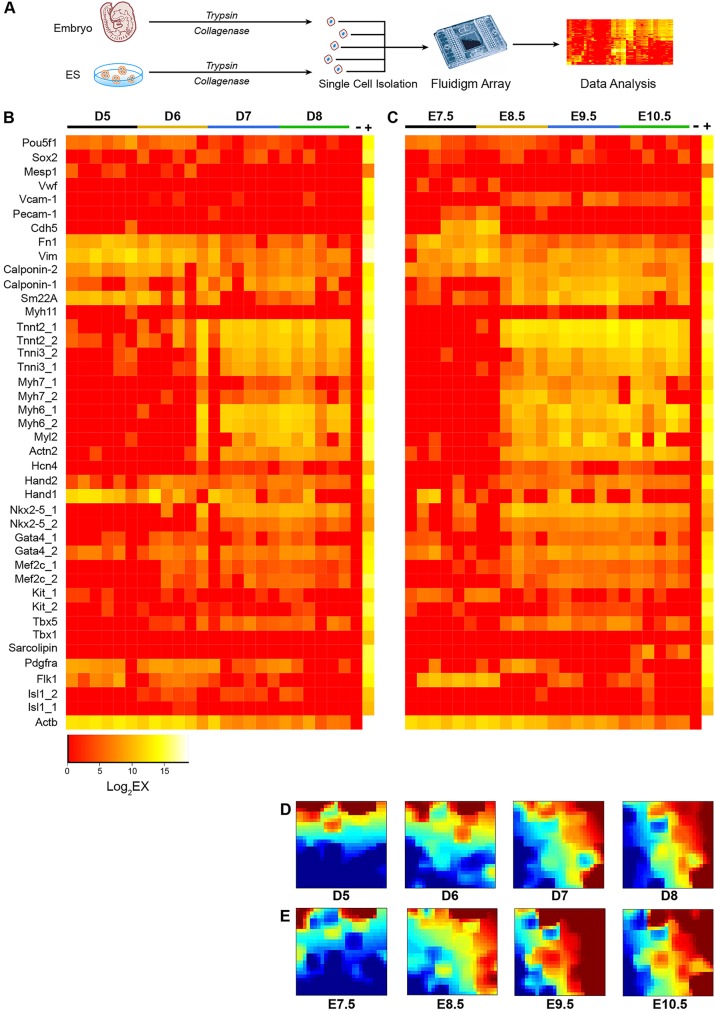
Fig. 3.
The transcriptional profiles of cardiac cells derived from mESCs and mouse embryos are highly similar. (A) Schematic diagram of mESC- and embryo-derived single cardiac cell profiling. (B) Expression profiles for single eGFP+ cells from in vitro differentiation of Nkx2-5–eGFP mESCs at days 5, 6, 7 and 8 of differentiation. (C) Expression profiles for single eGFP+ cells from Nkx2-5–eGFP transgenic mouse embryos at embryonic days 7.5, 8.5, 9.5 and 10.5. (D,E) GEDI plots depicting the gene expression signatures of single cells at different developmental stages. Each tile of the mosaic represents an SOM cluster of expressed genes. The SOM organizes genes by grouping together genes with the most similar expression levels. The color of each tile indicates gene expression levels, in which brown and red represent high levels of expression, and green and blue represent low to no expression. Data represent the results from two independent experiments.

