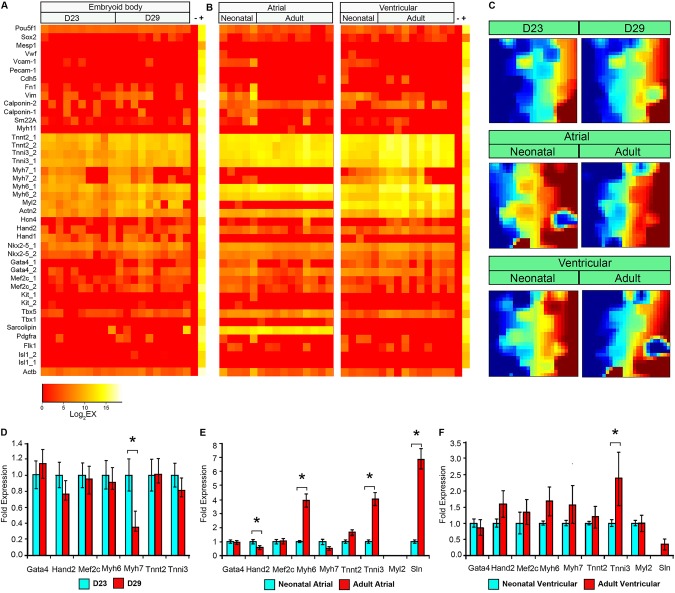
Fig. 4.
Comparison of gene expression profiles of single mESC-derived CMs after extended culture and those from adult mouse heart. (A) Expression profiles of single eGFP+ cells from in vitro differentiation of α-MHC-CRE/ROSA26-mTmG mESCs at days 23 and 29 of differentiation. (B) Expression profiles of single CMs from neonatal and adult mouse atrial and ventricular chambers. (C) GEDI plots for gene expression signatures of single cells at various stages. Note the difference between adult atrial and ventricular CMs and CMs generated from mESC differentiation. Some differences can also be observed between neonatal and adult CMs in the atria and ventricles. (D) qPCR analysis of sarcomeric protein genes and cardiac transcription factors from pooled eGFP+ cells at days 23 and 29 of in vitro α-MHC-CRE/ROSA26-mTmG mESC differentiation. (E) Same as in D, except that pooled neonatal and adult CMs were studied. The expression of Myl2 in these atrial CMs is relative to neonatal ventricular CMs. (F) Same as in D, except that pooled neonatal and adult ventricular CMs were studied. The expression of Sln in these ventricular CMs is relative to neonatal atrial CMs. Error bars represent s.e.m. *P<0.01. Data represent two independent experiments performed in triplicates.

