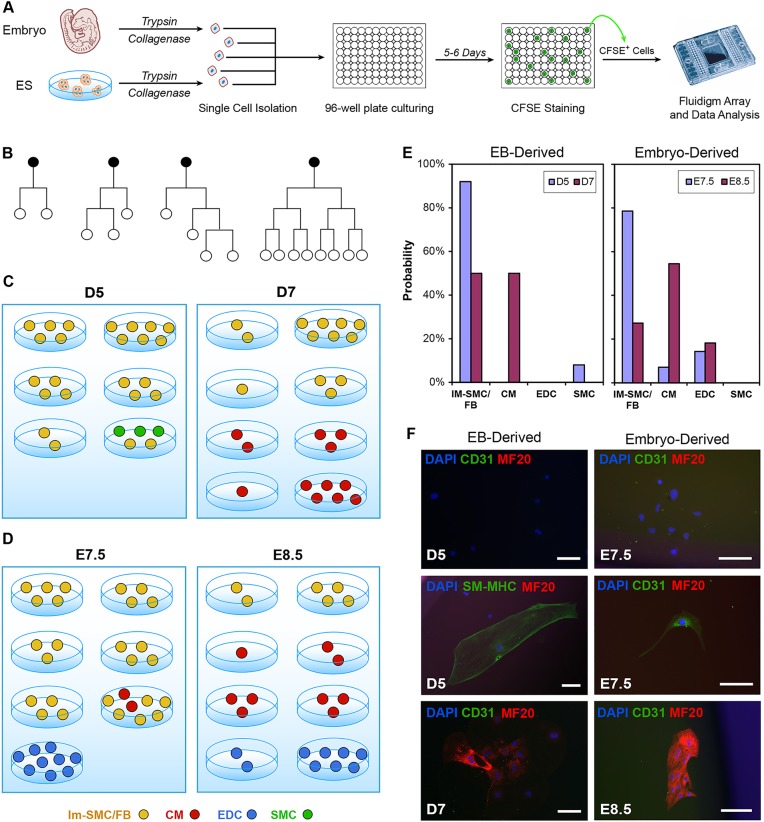
Fig. 5.
Characterization of lineage decisions by single CPCs during in vitro differentiation. (A) The lineage decision for each single CPC during in vitro differentiation was determined through profiling the gene expression in each individual progeny of that CPC. (B) Representative lineage trees of single CPCs (black dots) based on time-lapse video microscopy data. Note the varying behaviors of each CPC. (C) Identity of lineage progenies from single eGFP+ CPCs that have been isolated from day 5 (D5) and 7 (D7) of in vitro mESC differentiation. (D) Same as in C, except that Nkx2-5–eGFP mouse embryo-derived eGFP+ cells at E7.5 and E8.5 of development were studied. (E) Summary of the frequency that each single Nkx2-5–eGFP+ cell became a CM, SMC/FB or EDC during in vitro differentiation. (F) Immunofluorescence staining of CPC progenies for specific cell-lineage markers. Scale bars: 100 µm. Data represent the results from two independent experiments.

