Fig. 1.
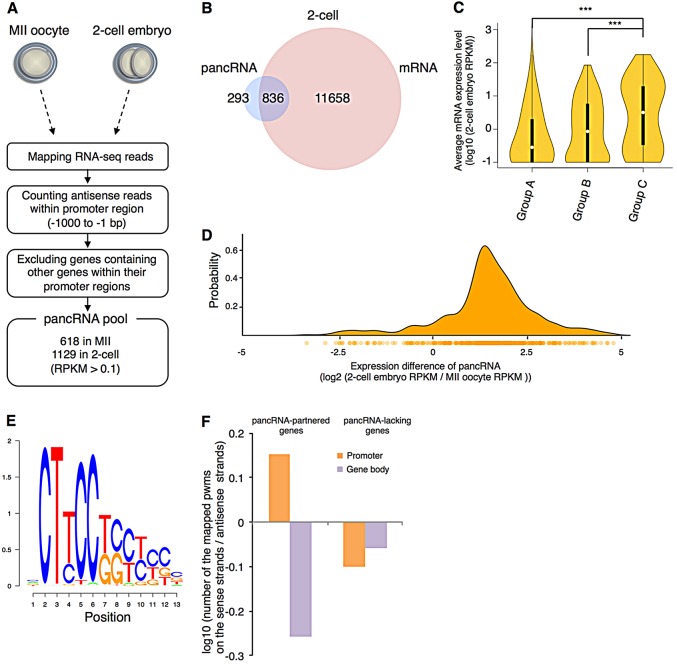
Characterization of pancRNAs by directional RNA-seq. (A) Screening of pancRNA datasets. One hundred oocytes or 2-cell embryos were used for each analysis, and four replicates were made for the statistical tests. (B) Numbers of pancRNA and mRNA species present in 2-cell embryos. (C) Violin plot of mRNA levels of 2-cell embryo genes with and without pancRNAs. Groups A, B and C comprise mRNAs without pancRNAs (11658), with the 100 most weakly expressed pancRNAs, and with the 100 most strongly expressed pancRNAs, respectively. Violin width and white circles indicate gene density and median expression levels of mRNAs, respectively. Box plots were merged and are indicated by black bars. ***P<0.001. (D) Expression difference of the pancRNA partners of the upregulated genes and their probability visualized as a density plot. Twofold upregulated genes (which correspond to 520 of the 836 genes in B) were selected. Below the density plot is a unidimensional plot of the expression difference of each pancRNA (circles), in which density is expressed by color intensity. (E) A frequently observed sequence motif in the promoter regions of pancRNA-partnered genes. (F) The frequency of the sequence motif in various gene regions. Sequences with 90% or greater identity to the position weight matrix (pwm) of the motif shown in E were categorized according to their presence on the sense or antisense strand of the promoter (−500 to −1 bp) and gene body (+1 to +500 bp) regions. The TSSs of the pancRNA-partnered genes provide the switching points for the observed asymmetric distribution of the CT-rich sequence.

