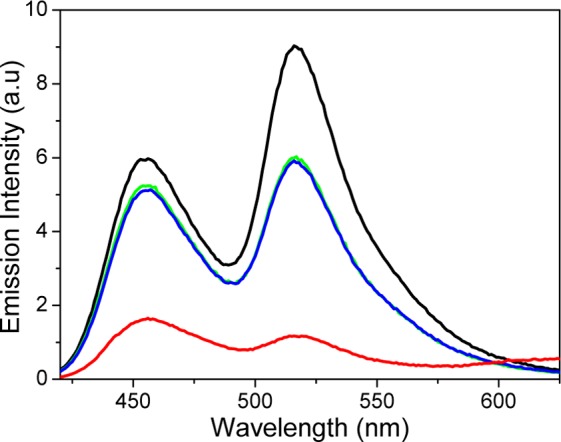
Figure 2.

Emission intensities (excitation at 410 nm) for the OPB-A488 double-strand before (black line) and after (green line) the addition of 25 μM 1SP. The red line shows the emission intensity after 2 min. 254 nm UV irradiation to isomerize 1SP to the DNA-binding forms 1MC and 1MCH+, whereas the blue line is the emission after subsequent visible light irradiation (5 min, λ > 450 nm) to trigger the reverse isomerization to 1SP.
