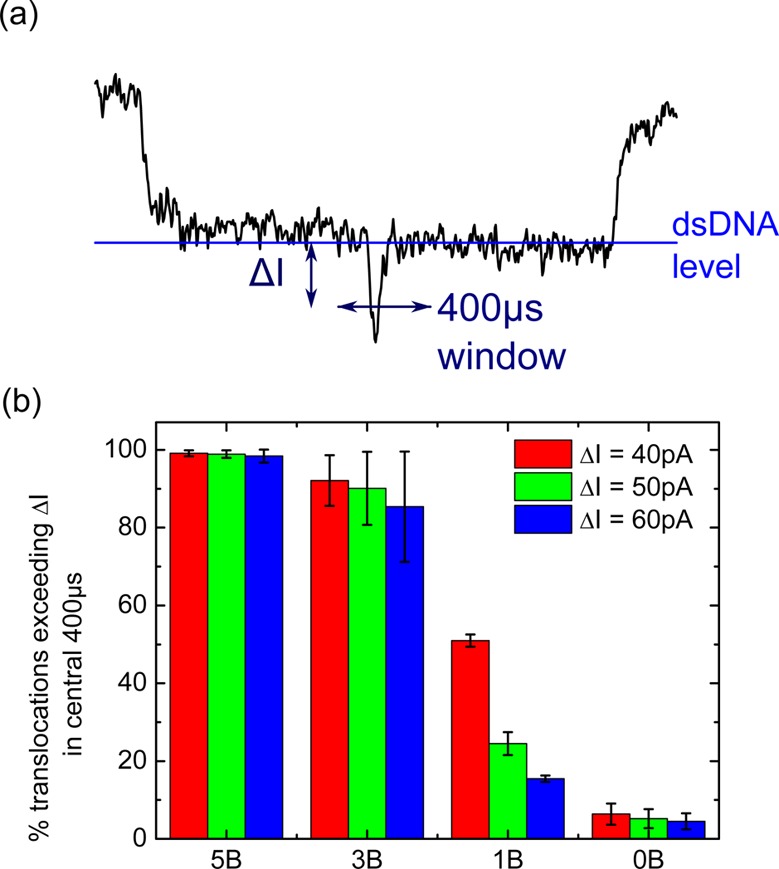
Figure 3.

Analysis of detection efficiency for different numbers of bound proteins. (a) A 400 μs window is created at the center of the translocation. The threshold ΔI (from the one double strand DNA level) is varied, and in (b) the percentage of translocations exceeding ΔI in the 400 μs window is calculated. The percentage is shown for designs 5B, 3B, 1B and 0B with 5, 3, 1, and 0 streptavidin attached, respectively. Error bars are the standard deviation from N independent nanopores with N = 3 (for 5B and 1B), N = 5 (for 3B) and N = 6 (for 0B) (raw values given in Tables S2–S5).
