
Figure 11.
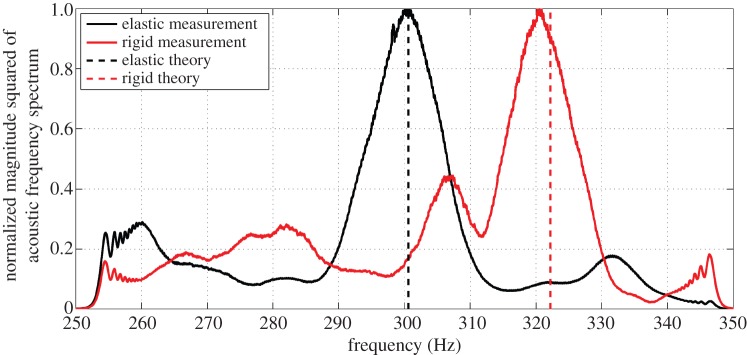
The measured Helmholtz resonance frequency of a violin with rigidly clamped top and back plates (solid red curve) is an excellent match (within roughly 1%) to the rigid instrument analysis (equation (4.3), dashed red line). When the plate clamps are removed, the measured resonance frequency (solid black curve) reduces by roughly 6% or a semitone, consistent with the reduction expected from elastic volume flux analysis for the violin (dashed black line). The two spectra shown are normalized by their respective peak amplitudes. The violin is externally stimulated with white noise. The violin used here has LF=70.5 mm, V =1580 cm3, hsh=2.7 mm, ha=35.9 mm, htop=2.5 mm and hback=3 mm. Other physical parameters are given in table 1.