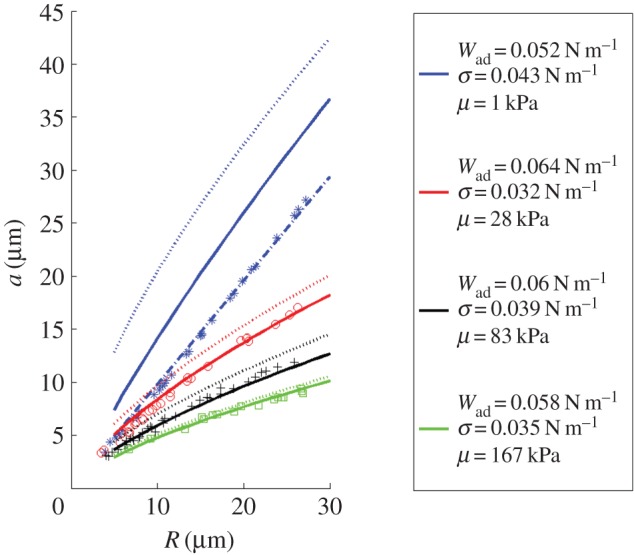
Figure 10.

Comparison with experimental data of Style et al. [5]. Symbols are experimental data. Solid lines are predictions based on small deformation theory with air–substrate surface tension. Dotted lines are based on small deformation theory without surface tension. Prediction of large strain solution in partial wetting liquid-like limit (4.1) is shown as a dashed-dotted line. The parameters used for these fits are based on the paper by Xu et al. [6]. (Online version in colour.)
