
Figure 4.
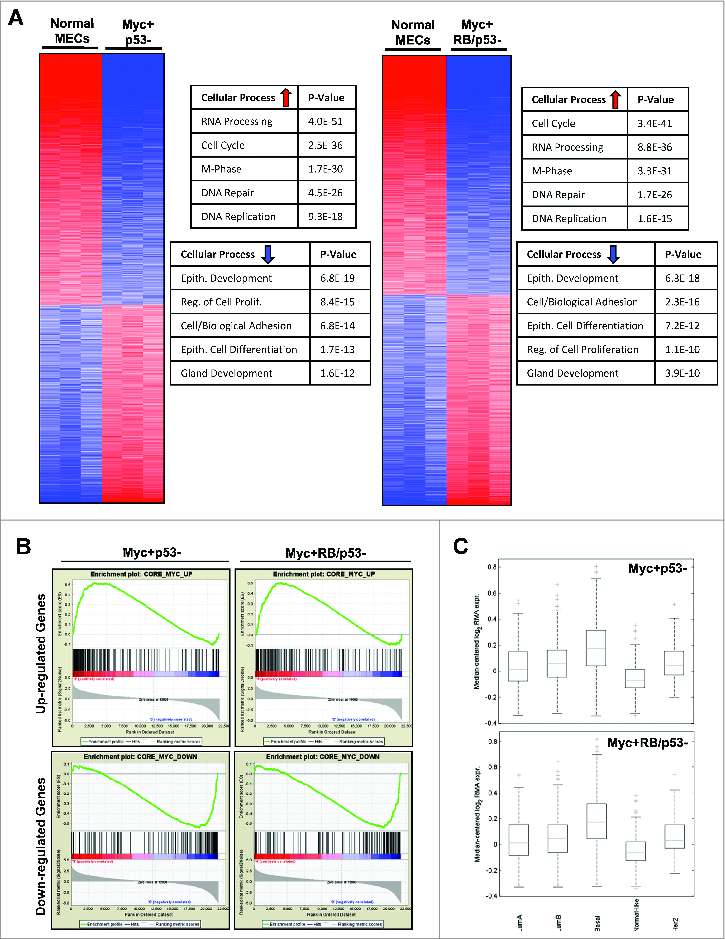
MYC-overexpressing mMECs exhibit significant gene alterations that correlates with basal-like breast cancer. (A) Changes in gene expression of RB-proficient (left) and RB-deficient (right) MYC-overexpressing mMECs compared to wild-type mMECs are displayed as heat maps. Top rated gene ontology results for upregulated and downregulated genes are highlighted in the accompanying tables. (B) Enrichment analyses of upregulated (top) and downregulated (bottom) genes in MYC+RB/p53- (left) and MYC+RB-p53- (right) mMECs compared to the human MYC-overexpression gene signature are displayed. (C) Gene expression profiles of MYC+RB+p53- (top) and MYC+RB/p53- (bottom) mMECs correlated with human breast cancer gene expression signatures.