. 2015 Feb 9;4:e04585. doi: 10.7554/eLife.04585

Figure 2. 8 ms IPI repeated paired TMS (Experiment 1).

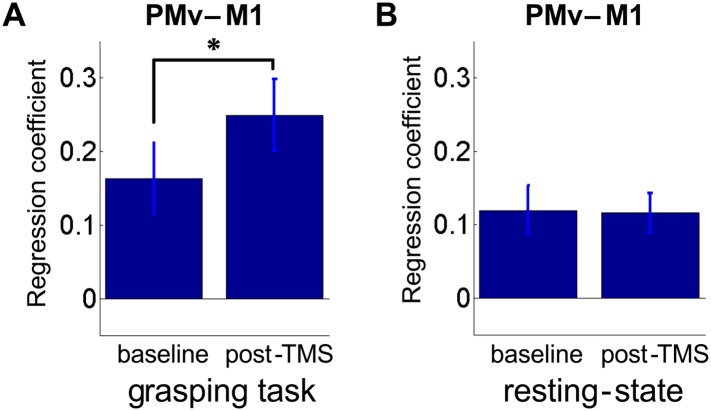
Group correlation maps seeded from PMv (red circle) during the grasping task (N = 14) (A, B) and in the resting state (N = 15) (D, E) in the baseline (A, D) and post-TMS sessions (B, E) with a spatial extent threshold of Z > 2.3 and a significance threshold of p < 0.05. There was an increase in PMv-M1 coupling during grasping (C), but not in the resting state (F). The blue circle covers the M1 ROI from which correlation coefficients were extracted. Error bars represent 1 s.e.m.

DOI: http://dx.doi.org/10.7554/eLife.04585.004

Figure 2.

Figure 2—figure supplement 1. 8 ms IPI repeated paired TMS (Experiment 1).

Figure 2—figure supplement 1.

Mean group regression coefficients for PMv-M1 connectivity during the grasping task at baseline and post-TMS (N = 14). There was an increase in PMv-M1 coupling during grasping (A). There was no change in PMv-M1 functional connectivity during rest as shown by mean group regression coefficients for PMv-M1 connectivity at rest (N = 15) (B). Error bars represent 1 s.e.m.