
Figure 3.
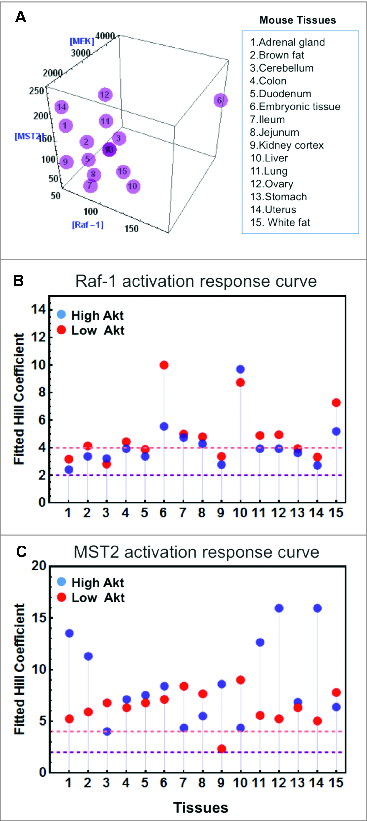
Existence of switches in mouse tissues. (A) Three-dimensional plot showing the concentrations of Raf-1, MST2 and MEK1/2 in 15 mouse tissues.41 (B and C) Hill coefficients of Raf-1 and MST2 activation in response to increasing Ras activation (RasGTP) were derived, as in.24 As Akt activity can influence the switching behavior, Hill coefficients were calculated under low (red dots) and high (blue dots) Akt activities. Hill coefficients of >2 indicate switch-like behavior, and Hill coefficients >4 strong switches. Model description and parameter values are same as in.24