
Figure 2.
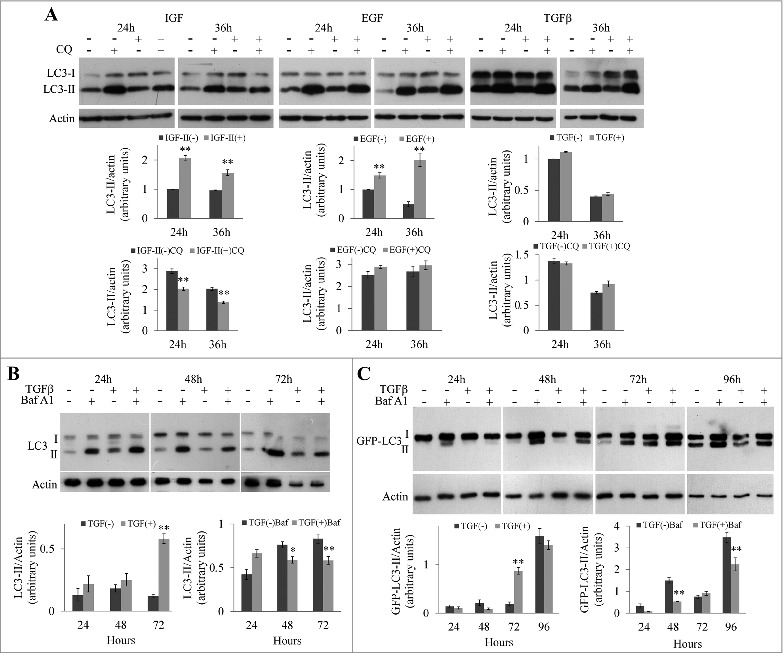
Analysis of autophagic flux in NBT-II, MDCK, and NMuMG cells during growth factors-induced EMT. (A) Expression of LC3 in NBT-II cells during EMT induced by TGFβ, IGF-II, or EGF. Cells were treated with growth factors for 24 or 36 h in the presence or absence of chloroquine (CQ) during the last 4 h. Levels of LC3-I and II and actin were determined by western blotting. The graph represents the LC3-II/actin ratio at the different time points. (B) Expression of LC3 in NMuMG cells during EMT. Cells were treated with TGFβ for 24 to 72 h in the presence or absence of bafilomycin A1 (BafA1) during the last 4 h. Expression of LC3-I, LC3-II, and actin were detected by protein gel blotting. The graph represents the LC3-II/actin ratio at the different time points. (C) MDCK/GFP-LC3 cells were treated with TGFβ for indicated times, and bafilomycin A1 (BafA1) was added for the last 4 h. GFP-LC3-I, GFP-LC3-II, and actin were detected by western blotting using anti-GFP and anti-actin antibodies respectively. The graph represents the GFP-LC3-II/actin ratio at the different time points.