
Figure 2.
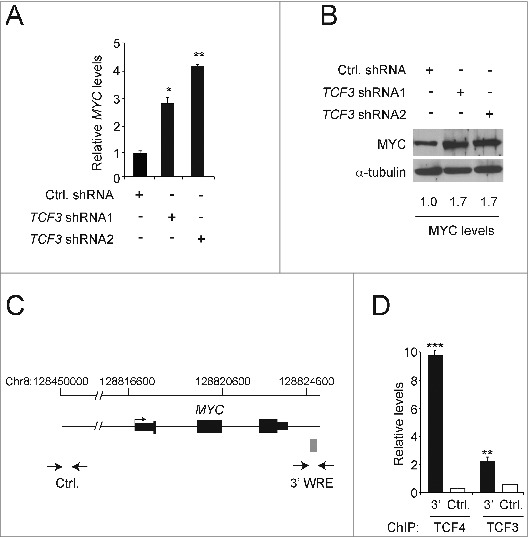
TCF3 represses MYC gene expression. (A) qPCR analysis of cDNAs prepared from HCT116 cells expressing control or TCF3-specific shRNAs. The values presented are normalized to GAPDH levels. (B) Western blot analysis of MYC protein levels in HCT116 cells expressing control or TCF3-specific shRNAs. The blots were reprobed with anti-α-tubulin antibodies to control for equal loading. (C) Diagram of the MYC gene locus. Exons and UTRs are depicted by black rectangles with an arrow marking the major transcription start site. The gray box marks the position of the MYC 3′ WRE. Opposed arrows indicate the positions of the PCR primers used for the chromatin immunoprecipitation (ChIP) assays depicted in D. The control region maps approximately 290-kb upstream from the MYC transcription start site. (D) qPCR analysis of DNA fragments precipitated using TCF4- or TCF3-specific antibodies in ChIP assays conducted in HCT116 cells. All experiments were repeated at least 3 times and error bars are ± SEM (*P < 0.05, **P < 0.01, ***P < 0.001).