
Figure 3.
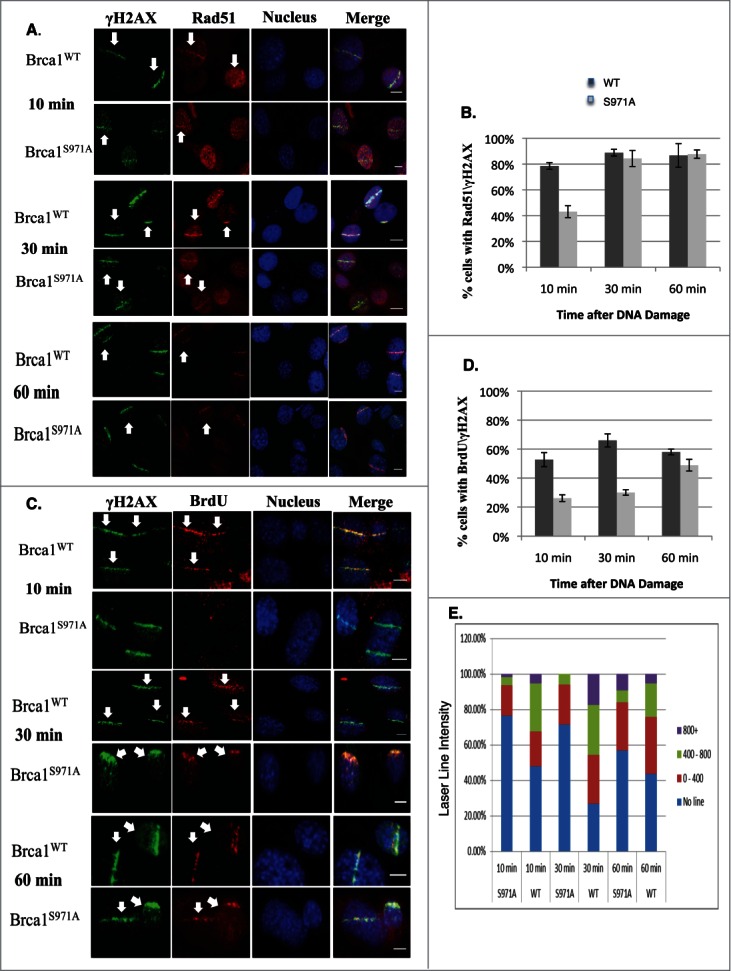
Brca1S971A/S971A MEF has delayed end-resection in response to DSBs. (A) Rad51 laser stripes (red) and γH2AX (green) from S/G2 cells at 10 min, 30 min and 60 min time points. Scale bar, 10μm. (B) Average from 6 independent experiments (3 experiments from each pair of MEFs). Ten min (n = 338and303, p = 2.87E-05); 30 min (n = 377and383, p = 0.26); 60 min (n = 426and330, p = 0.45). (C) Representative BrdU (ssDNA) stripes (red) and γH2AX (green) from total cell population at 10, 30 and 60 min time points. 55% laser output and 2 hrs of BrdU incorporation. (D) Average from 6 independent experiments (3 experiments/pair of MEFs). Ten min (n = 740and640, p = 0.000584); 30 min (n = 710and617, p = 2.65E-05); 60 min (n = 682and605, p = 0.069). (E) Quantification of BrdU stripe intensity from one representative experiment. Intensities are displayed with arbitrary units defined by Image J software.