
Figure 5.
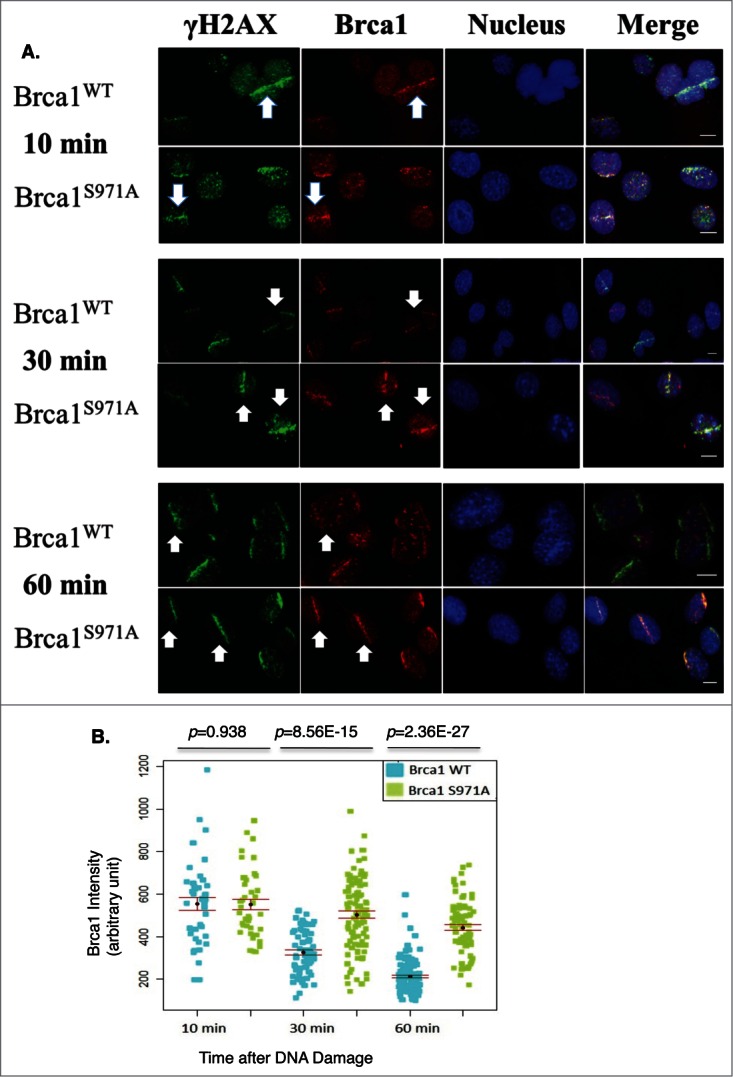
Retention/Slower dispersion of Brca1(S971A) at DSBs. (A) Brca1 (red) stripes at 10, 30, and 60 min time points after microirradiation. 47% laser output and 2 hrs of BrdU incorporation. Scale bar, 10 μm. (B) The average intensity of Brca1 stripes over a 60 min time course. Quantification of each Brca1 stripe with arbitrary units defined by Image J software and shown in a dot plot.