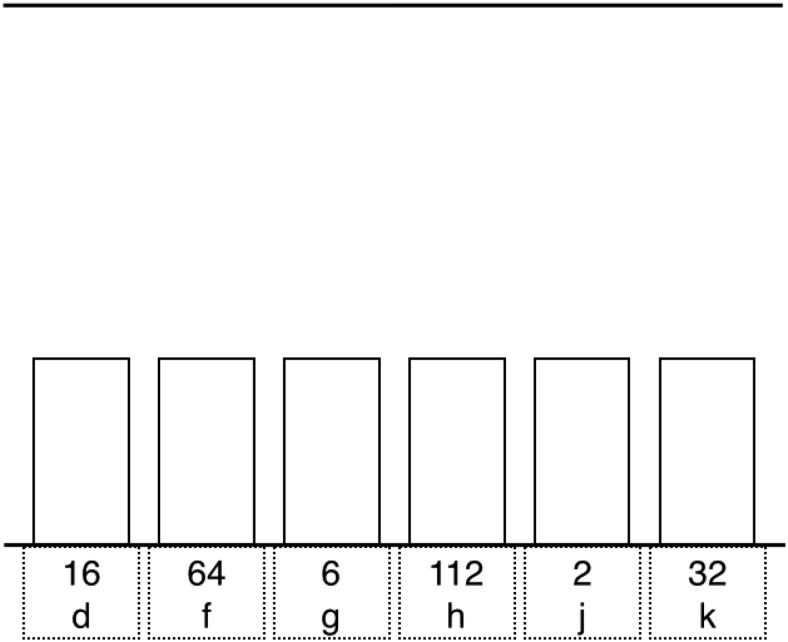
Figure 2.
Regions (dotted lines) defined for the analysis of the acquired eye-tracking data made during the decision-making phase (0–3,500 ms). The size of each region was 90 × 99 pixels. For display purposes, we have only used black and white (see the Method section for a detailed description of the stimuli and their colors).

