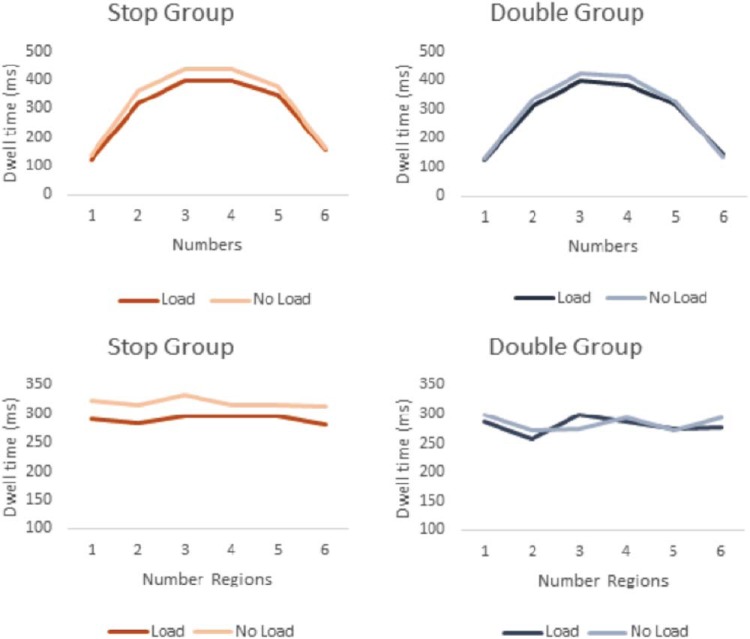
Figure 3.
Dwell-time data from Experiment 1. The top panels show the mean dwell times during the decision-making phase for the six regions containing amounts arranged from left to right independently of the magnitude of the bet (1 being the leftmost region). In both groups, there was more dwell time for these regions in no-load blocks than in load blocks. There was also more dwell time for the more centrally presented bets. The bottom panels show the mean dwell times during the decision-making phase by amount irrespective of spatial location (1 being the lowest bet). See the online article for the color version of this figure.

