Figure 4.
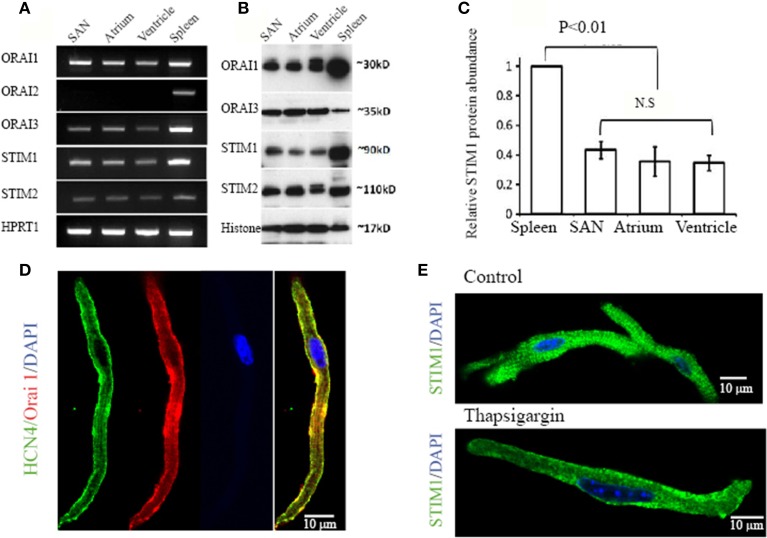
Expression of STIM and Orai molecules in mouse cardiac myocytes. (A) Total RNA was isolated from pacemaker cells (SAN), atrial myocytes (Atrium), ventricular myocytes (Ventricle) and spleen. Transcripts of Stim1, Stim2, Orai1, Orai2, and Orai3 in cardiac myocytes were compared with the spleen as positive control. The housekeeping gene Hypoxanthine–Guanine Phosphoribosyltransferase (HPRT1) was used as an internal control. (B) Protein levels of STIM1, STIM2, Orai1, and Orai3 were examined in total protein extracts from SAN region (SAN), atrium (Atrium), ventricle (Ventricle) and spleen and determined by Western Blot analysis. The nuclear protein histone was used as loading control. (C) Bar graph showing quantitative western blot analysis of STIM1 protein levels in spleen and heart with heart samples normalized to spleen as 1 (n = 3 gels, P < 0.05, ANOVA). (D) Confocal images of an isolated pacemaker cell shows expression of HCN4 (green in color), a positive marker for pacemaker cells. The cell also positively stained with anti-Orai1 antibody (red in color). The nucleus is stained blue with DAPI. A merged image on the left shows the co-localization of HCN4 and Orai1 along the surface membrane (color in yellow). (E) Representative confocal images of an isolated pacemaker cell labeled with STIM1 (green in color) and DAPI (blue in color). When perfused with normal Ca2+ containing solution, positive STIM1 staining was distributed both intracellularly and in the cell periphery as showed in the top panel. When perfused with Ca2+-free solution containing thapsigargin, STIM1 peripheral localization was enhanced, as shown in the bottom panel.

