
Figure 5.
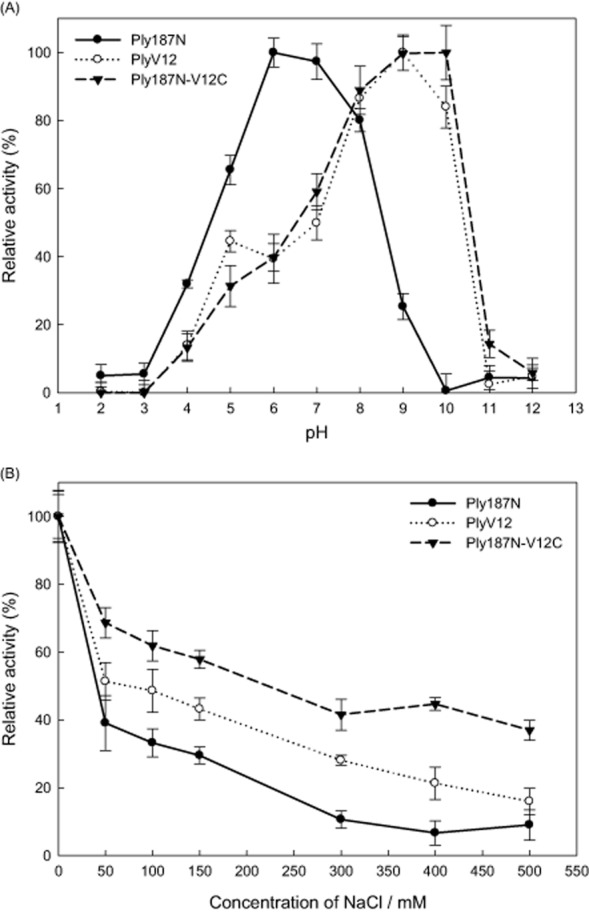
The relative activities of the three lysins in 20 mM boric acid and 20 mM phosphoric acid buffer at different pH (A) and in 5 mM Tris-HCl buffer (pH 7.4) with different ionic strength (B). The decrease in OD600 is monitored for 1 h after addition of lysis buffer or lysins to a 2 μM final concentration.