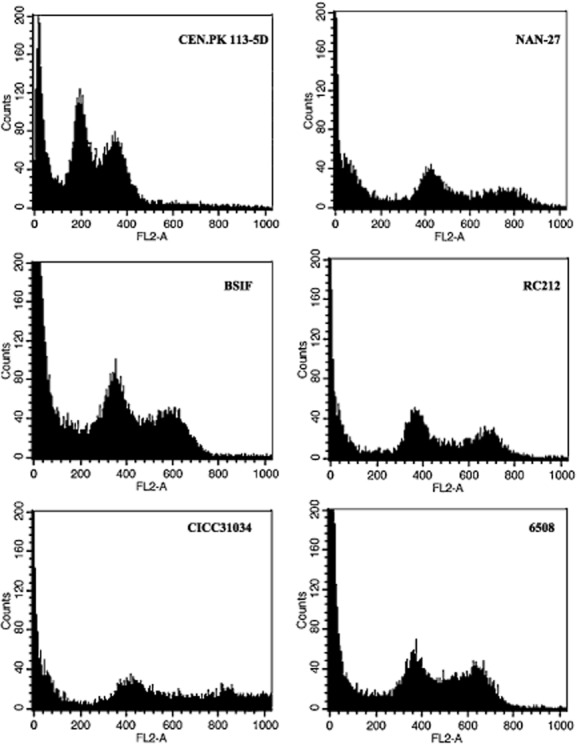
Figure 5.

Determination of DNA content by flow cytometry of S. cerevisiae strains. Strains were grown to exponential phase then fixed with ethanol, and the DNA was stained with propidium iodide. The x-coordinate FL2-A represents total cell fluorescence, and it is proportional to DNA content. Two Gaussian curves in density plot represent the G0/G1 and G2/M phase of cells respectively. The strain ploidy was then determined by the G0/G1 peak value on FL2-A versus that of the haploid strain, which was set as 200.
