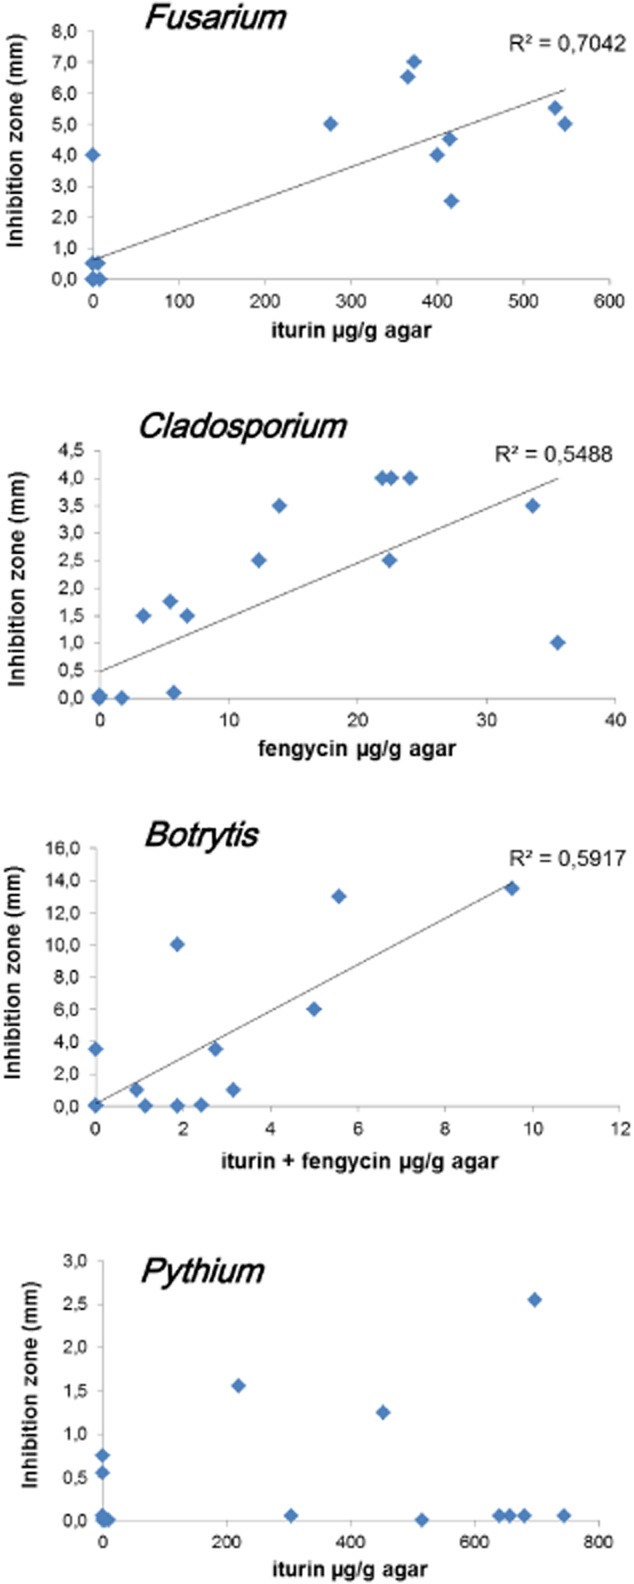
Figure 3.

Correlations between LP concentration in the inhibition zone and intensity of the antagonism. Agar samples were taken from the inhibition zone, extracted with 50% ACN and analysed for LP content by UPLC-MS. Presented data are means from two biological repeats.
