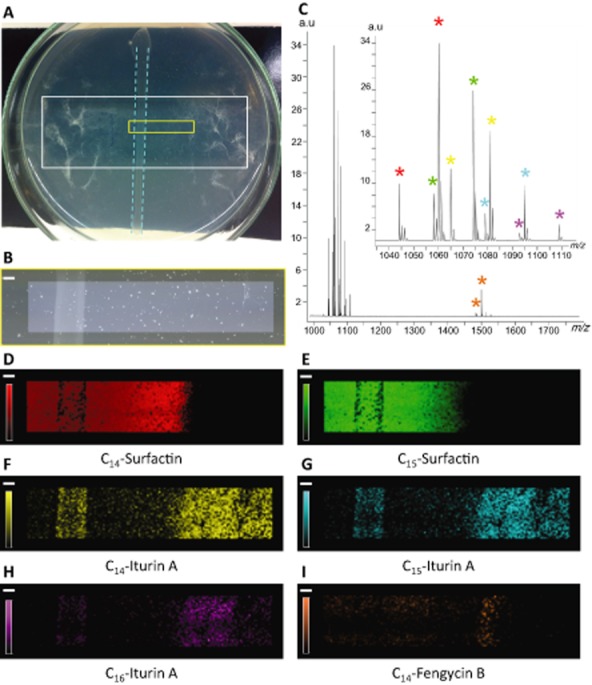
Figure 6.

MALDI-MS imaging reveals the involvement of LPs in B.a. 98S antagonism against F. oxysporum.A. Picture of the confrontation plate, containing the Indium-Tin Oxide (ITO)-coated glass slide (white rectangle) on which strain 98S was streaked in the middle of the slide (blue dotted lines) and left to incubate during 2 days. Fusarium was then inoculated close to and at distance of the bacterial colony and left to incubate three more days. After drying and matrix coating, the molecular content of the inhibition zone was screened over the area represented by the yellow rectangle.B. Microscope picture of the analysed area (4.59 × 22.38 mm2).C. Average MALDI mass spectrum, recorded on the inhibition zone (4350 pixels, pixel step size 150 μm) over the mass range 990–1800 m/z. The inset represents a zoom on the mass range 990–1115 m/z, showing the signals of surfactins and iturins, detected as sodium [M+Na]+ and potassium [M+K]+ adducts. Red stars indicate sodium (m/z 1044.63) and potassium (m/z 1060.68) adducts of C14-surfactin, distribution of which is shown in D. Green stars indicate sodium (m/z 1058.63) and potassium (m/z 1074.67) adducts of C15-surfactin, distribution of which is shown in E. Yellow stars indicate sodium (m/z 1065.53) and potassium (m/z 1081.57) adducts of C14-iturin A, distribution of which is shown in F. Blue stars indicate sodium (m/z 1079.52) and potassium (m/z 1095.56) adducts of C15-iturin A, distribution of which is shown in G. Purple stars indicate sodium (m/z 1093.51) and potassium (m/z 1109.55) adducts of C16-iturin A, distribution of which is shown in H. Orange stars indicate sodium (m/z 1485.76) and potassium (m/z 1501.80) adducts of C14-fengycin B, distribution of which is shown in I. Scale Bar: 1 mm.Intensity scale is between 5% and 100%.
