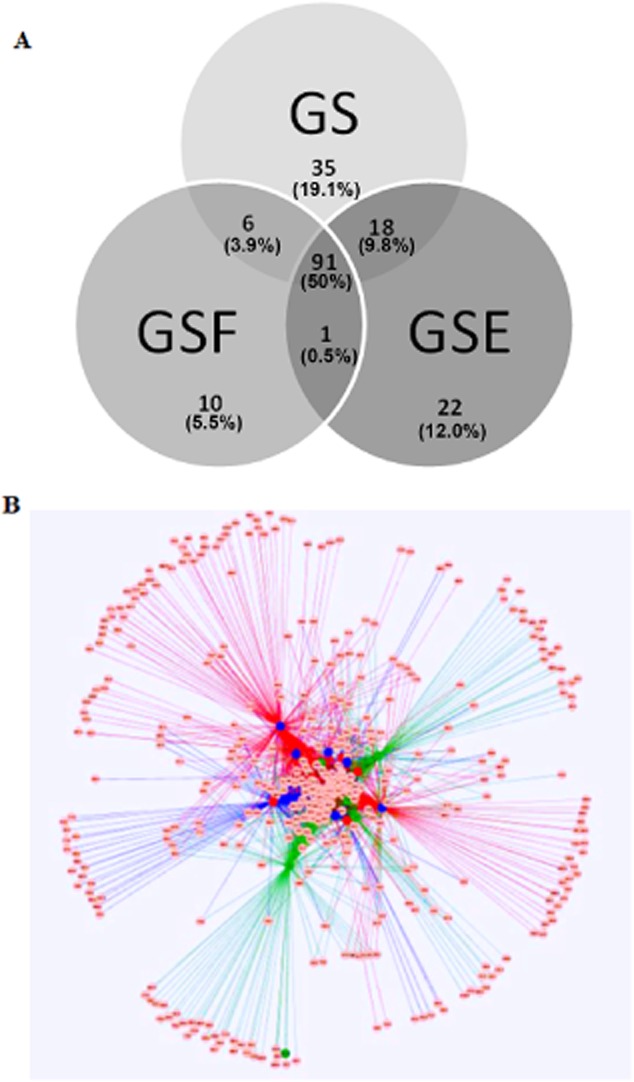
Figure 3.

Venn diagram of the rumen core microbiome (found in each dietary intervention at least once) of steers fed grass silage (GS); red – GS and flax oil; blue – GS and echium oil, based on genus-level classification. Brackets show % genus overlap between diets and genera, which are core to all steers irrespective of diet (A). Spring-embedded weighted network map of microbiota with nodes representing operational taxonomic units (OTUs), and each line indicating that an OTU was identified in the same source (B). (Green – rumen samples from grass silage and sugar beet (GS)-fed steers; red – GS and flax oil; blue – GS and echium oil; network map was created based on steer so an evaluation of animal variation could be made).
