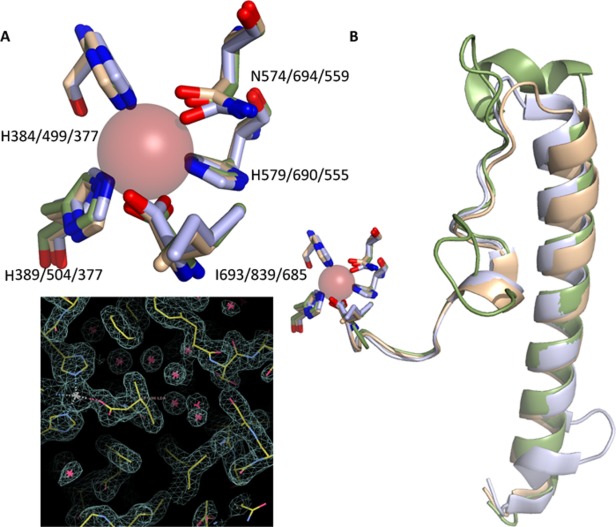
Figure 4.

Figure The iron coordination sphere. (A) Superposition of the iron ligands from representative plant (1YGE) animal (4QWT) and bacterial (4G32) structures. (B) The C-terminal region of the enzymes; a long loop that follows the terminal α-helix makes its way to the catalytic iron so that the carboxyl can fill the coordination sphere. (C). A portion of the electron density map for 8R-LOX (3FG1), centered around the C-terminal Ile. Note the presence of a water-filled cavity that accommodates the terminal Ile.
