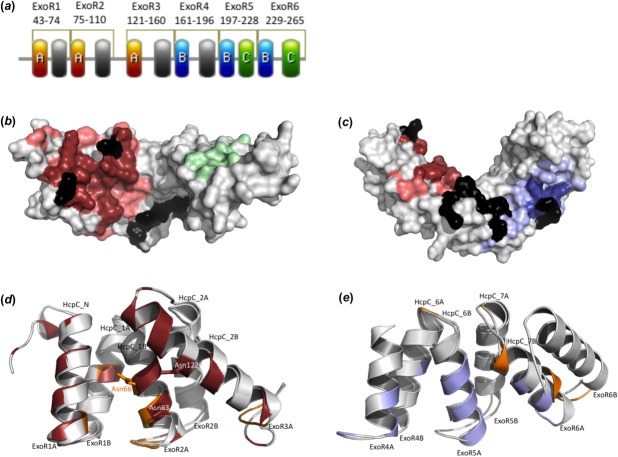
Figure 4.
(a) Location of putative protein–protein interaction sites. The sites A, B, and C are colored red, blue, and green, respectively. (b, c) Putative functional sites mapped to the surface of ExoRm protein. Site A (residues identified by more than one prediction program in red; residues predicted using just one program in light red) and site C (green) in (b); and site B (residues identified by more than one prediction program in blue; residues predicted using just one program in light blue) in (c). Residues identified as hot spots are shown in black. (d) Superposition of the crystal contact II (orange) of HcpC protein12 and site A (red) of ExoR. The superposition is based on residues 28–116 from HcpC and residues 31–143 from ExoR. The side-chains of Asn66 (HcpC), Asn83 (ExoR), and Asn122 (ExoR) are shown. (e) Superposition of the crystal contact I (orange) of HcpC protein12 and site B (blue) of ExoR. The superposition is based on residues 225–292 from HcpC and residues 162–268 from ExoR.

