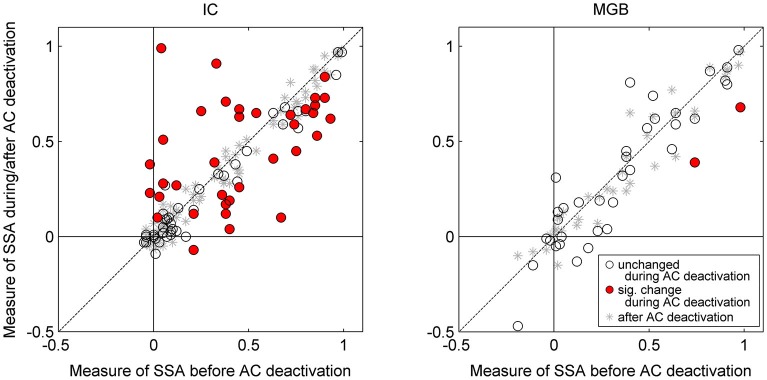
Figure 3.

Scatterplots for IC neurons (left panel) and MGB neurons (right panel) of CSI before cooling vs. CSI during cooling (circles) and after cooling (asterisks). Red circles indicate those neurons which show a significant change with cooling, whereas those with open circles indicate a non-significant change. All neurons included in the analyses returned to their previous CSI values after cooling (all asterisks lay along the line of equality for before vs. after cooling condition). Auditory cortical deactivation could have one of three effects on the SSA sensitivity of IC neurons; CSI values either showed no change, or a significant decrease or increase. By contrast, CSI values in the MGB were unchanged during cortical cooling (with the exception of two neurons which showed a significant decrease in SSA). Data plotted from Antunes and Malmierca (2011), and Anderson and Malmierca (2013).
