
Figure 1.
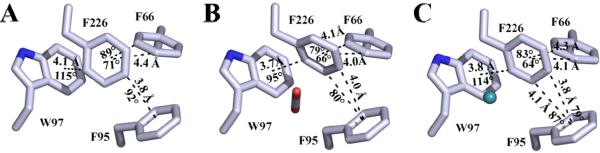
X-ray crystallographic structures of (A) native HCA II (PDB: 3KS3; (25)) (B) HCA II with CO2 bound (PDB: 3D92; (14)) and (C) HCA II with Xe bound (PDB: 3CYU; (15)). Models are shown as sticks with carbon colored light blue, oxygen red, nitrogen blue and xenon cyan. Potential C-H···π interactions between F226, F66, F95 and W97 are represented by dashed lines with distances and angles defined as in Table 4.