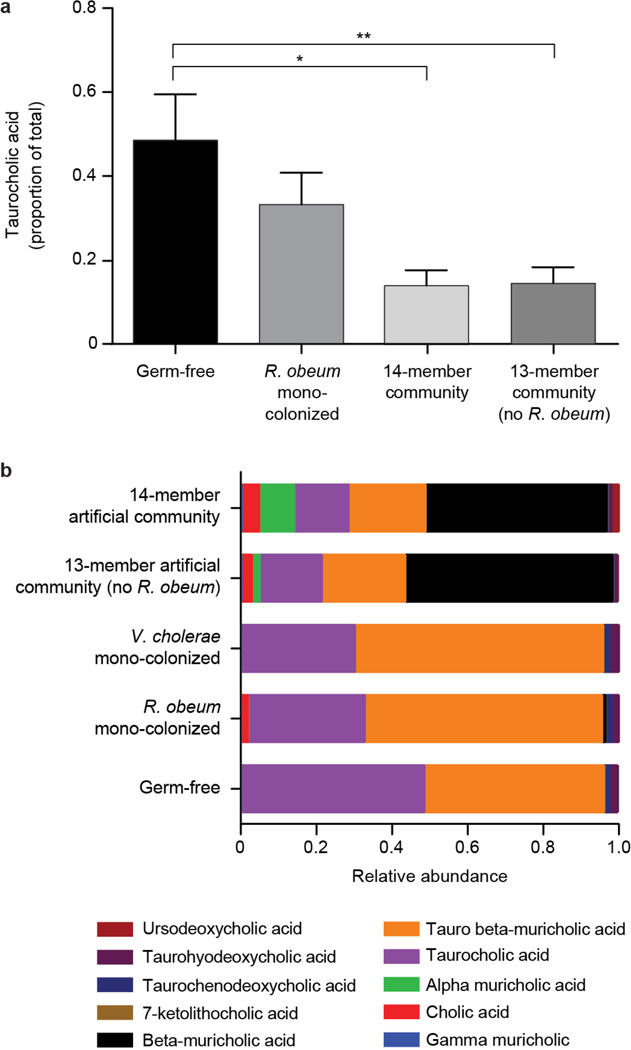
Extended Data Figure 8. UPLC-MS analysis of fecal bile acid profiles in gnotobiotic mice.
Targeted UPLC-MS was performed using methanol extracts of fecal pellets obtained from age-and gender-matched germ-free C57BL/6J mice and gnotobiotic mice colonized for 3 days with R. obeum alone, for 7d with the 14-member community (‘D1invasion group’), and for 3 days with the 13-member community that lacked R. obeum (n=4–6 mice/treatment group; one fecal sample analyzed/animal). (a) Fecal levels of taurocholic acid. Mean values±SEM are plotted. *, P<0.05, **, P<0.01, Mann-Whitney U test. (b) Mean relative abundance of 10 bile acid species in fecal samples obtained from the mice shown in panel (a).

