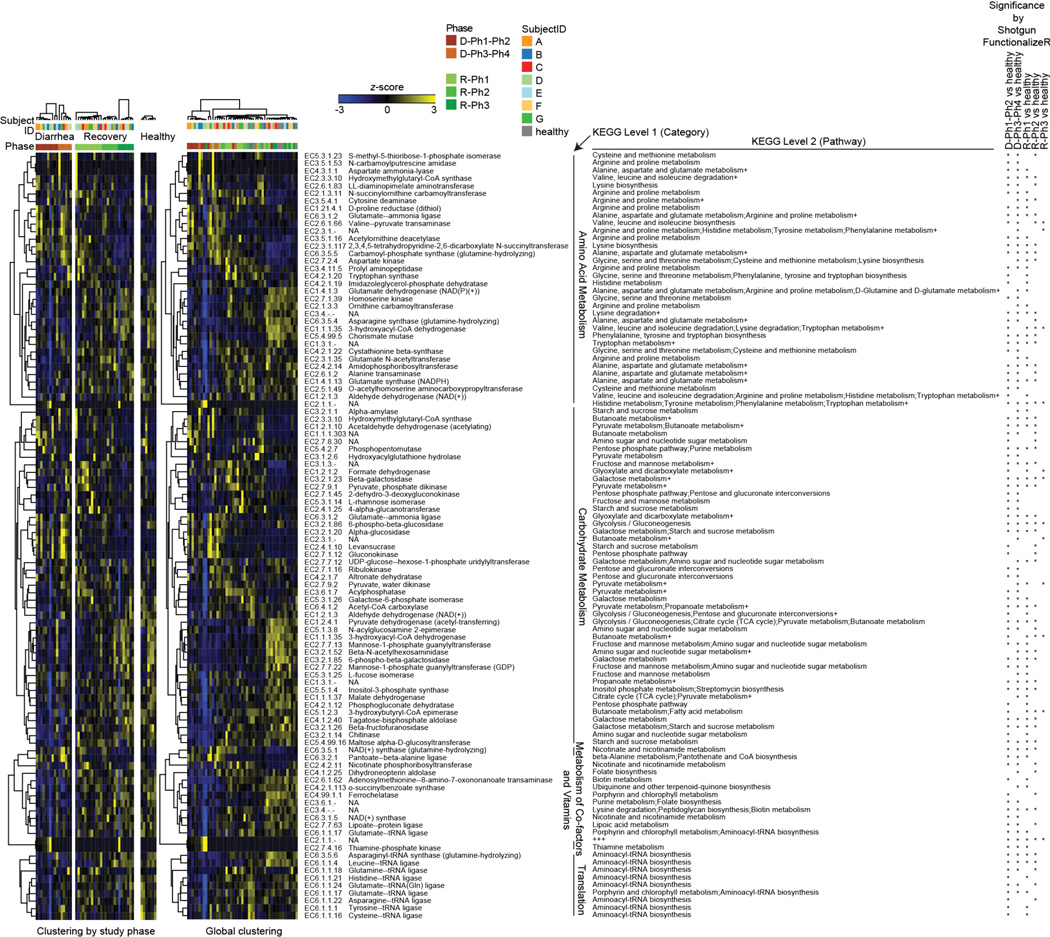
Extended Data Figure 6. Proportional representation of genes encoding ECs in fecal microbiomes sampled during the diarrheal and recovery phases of cholera.
Shotgun sequencing of fecal community DNA was performed [MiSeq 2000 instrument; 2×250bp paired-end reads; 341,701±145,681 reads (mean ± SD/sample)]. Read pairs were assembled (SHERA software package34). Read counts were collapsed based on their assignment to Enzyme Commissions number identifiers (ECs). The significance of differences in EC abundances compared to fecal microbiomes in healthy adult Bangladeshi controls was defined using ShotgunFunctionalizeR39. Unsupervised hierarchical clustering identifies groups of ECs that characterize the fecal microbiomes of cholera patients at varying phases of diarrhea and recovery. The heatmap on the left shows the results of EC clustering by phase (diarrhea/recovery). An asterisk on the extreme right of the figure indicates that EC abundance differences observed across the specified study phases were statistically significant (adjusted P<0.00001, ShotgunFunctionalizeR). The heatmap on the right presents the results of a global clustering of all time-points and study phases. 102 ECs were identified with (i) at least 0.1% average relative abundance across the study, and (ii) significant differences in their representation relative to healthy microbiomes in at least one comparison (adjusted P<0.00001 based on ShotgunFunctionalizeR). In each of the heatmaps, Z-scores for each EC across all samples are plotted. ECs are grouped by KEGG Level 1 assignment and further annotated based on their KEGG Pathway assignments. A ‘+’ indicates that the EC has additional KEGG Level 2 annotations (see Supplementary Table 8 for a list of all assignable functional annotations). Note that the majority of the 46 ECs that were more abundant during diarrhea phases in study participants are related to carbohydrate metabolism. The fecal microbiomes of patients during recovery are enriched for genes involved in vitamin and co-factor metabolism (Supplementary Table 8).

