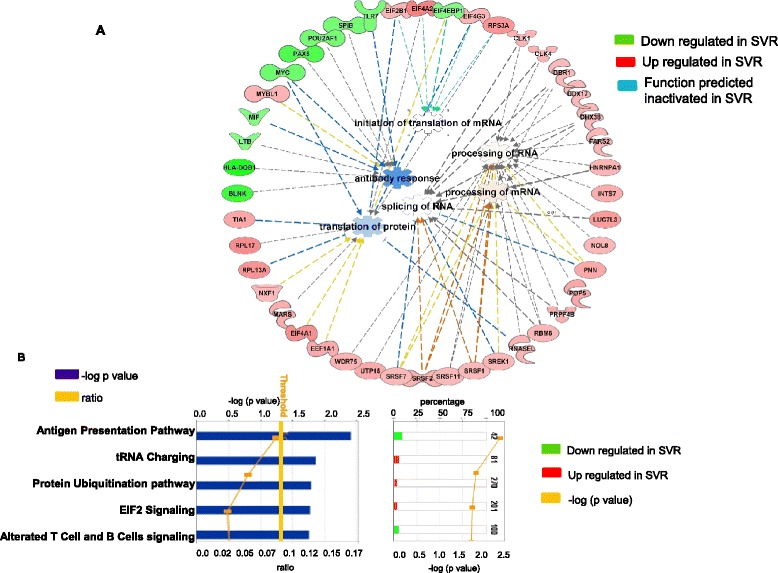
Figure 2.

Functional analysis conducted on genes differentially expressed in HCV patients with diverging treatment response. A) IPA analysis conducted on the 476 transcripts differentially expressed in SVR vs. NR patients showed in the top network that molecules involved in mRNA processing and protein synthesis (such as SRSF molecules) are up regulated (in red) in SVR samples. B) Top 5 significant ranking significant (threshold p value < 0.05) canonical pathways conducted on the 476 transcripts reveled an up regulation of ubiquitination pathways as well as tRNA charging pathways in SVR patients. On the contrary, molecules involved in antigen presentation pathways are showed to be down regulated in SVR patients. The p value for each pathway is indicated by the blue bar and is expressed as –1 times the log of the p value. The yellow line represents the ratio of the number of genes in a given pathway that meet the cutoff criteria divided by the total number of genes that make up that pathway.
