
Figure 3.
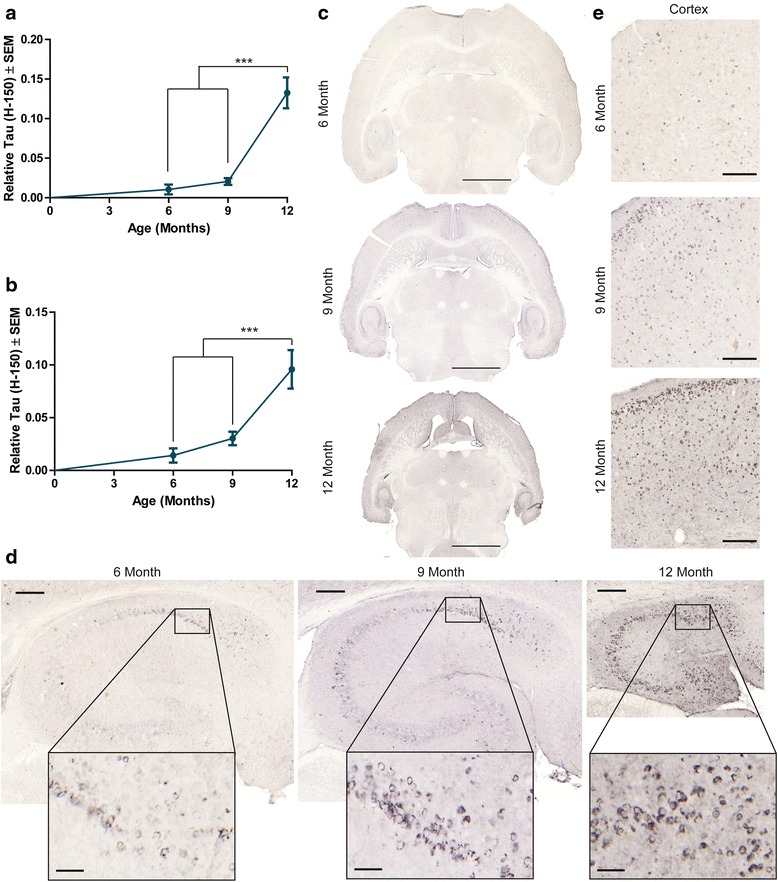
Tau (H-150) accumulation in aging rTg4510 mice. Tissue from aging rTg4510 mice were stained with total tau (H-150) and quantified for total tau (H-150) in the a hippocampus (± SEM) and b frontal cortex (± SEM) in rTg4510 mice. *** p <0.001. Representative images of a whole section stained with c total (H-150) tau from a 6-, 9-, and 12-month old rTg4510 mouse. Scale bar represents 2000 μm. Representative images from corresponding d hippocampus and e frontal cortex are shown. Scale bars represent 200 μm; hippocampus inset scale bar represents 50 μm.