
Figure 9.
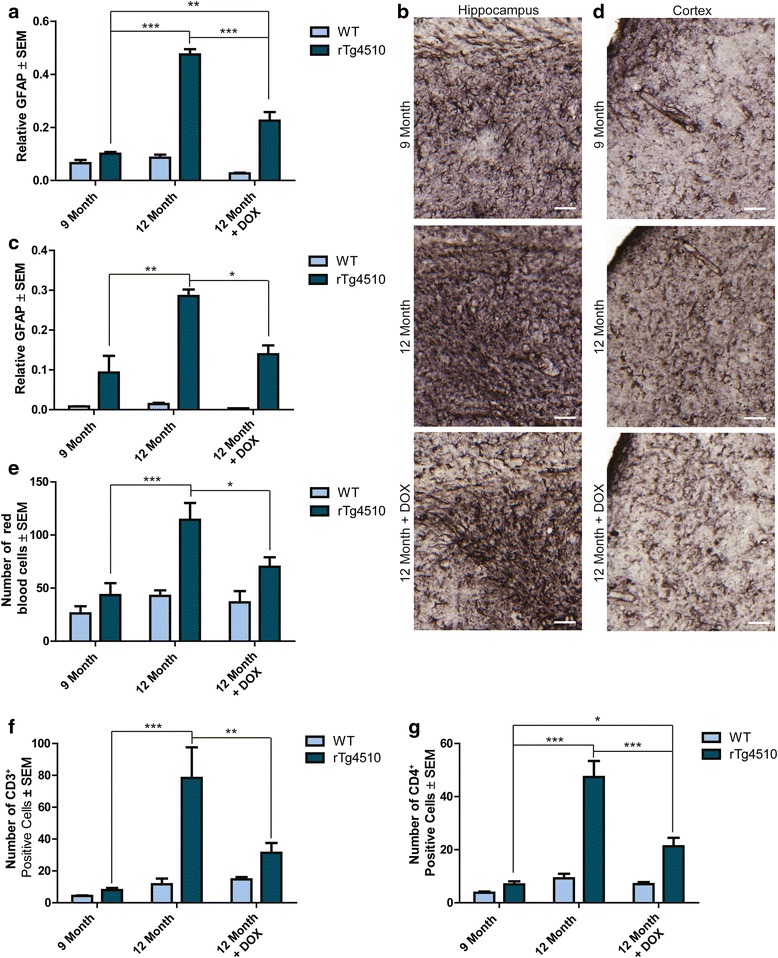
Effects of tau suppression on GFAP levels, RBCs and infiltration of T cell lymphocytes. Relative levels of GFAP positive astrocytes in the (a and b) hippocampus and (c and d) frontal cortex of 9-, 12-, and 12-month old + DOX treated rTg4510 and wild-type mice; representative images are shown. Scale bars represent 50 μm. * p <0.05, ** p <0.01, *** p <0.001. Number of e RBCs (± SEM) counted from H&E staining of 12-month old DOX-treated and 9-and 12-month old untreated rTg4510 mice relative to the levels of their wild-type littermates. * p <0.05, *** p <0.001. Number of f CD3+ (± SEM) and g CD4+ (± SEM) T cell lymphocytes in 9-, 12- and DOX-treated 12-month old rTg4510 mice compared wild-type controls * p <0.05, ** p <0.01, *** p <0.001.