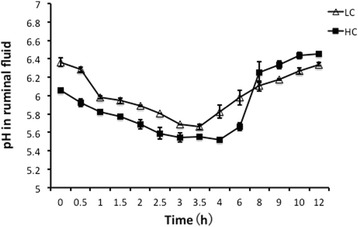
Figure 1.

Comparison of the pH values in the ruminal fluid between the low-concentrate (LC) and high-concentrate (HC) groups. The data were measured using ruminal fluid samples collected at times ranging from 0 to 12 hours (shown on the x-axis) for three days during the 18th week. Significant differences were observed across all of the sampling times (p < 0.05), with the exception of 8 hours after the morning feeding. The error bars indicate the standard error of the mean. The data were compared using Student’s t-test.
