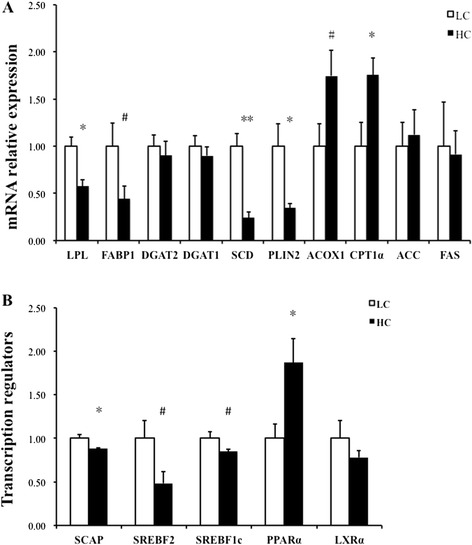
Figure 2.

The hepatic gene expression profile analyzed via real-time PCR. Each value was normalized to the expression of GAPDH, and data were compared using Student’s t-test between LC (n = 4) and HC (n = 4). A. The genes involved in desaturation, lipogenesis, fatty acid oxidation, TG synthesis and lipid droplet formation were measured in the liver tissue. The error bars indicate the standard error of the mean. * indicates p < 0.05; ** indicates p < 0.01; # indicates significance values between 0.05 < p < 0.1. B. The genes involved in transcriptional regulation were measured in the liver tissue. The error bars indicate the standard error of the mean. * indicates p < 0.05; ** indicates p < 0.01; # indicates significance values between 0.05 < p < 0.1.
