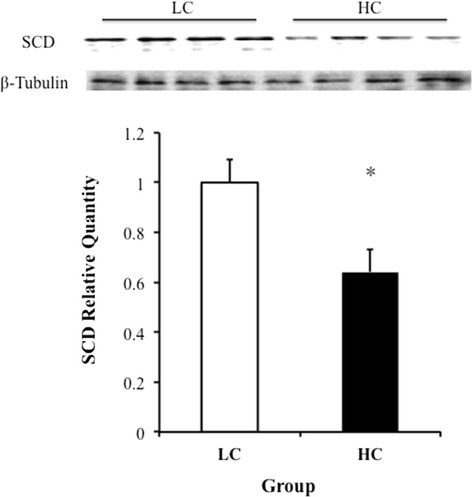
Figure 3.

The western blotting analysis of SCD in the liver. The SCD content was assessed via western blotting of the livers of the LC (n = 4) and HC (n = 4) cows. The protein was quantified via band density measurements of the western blot. The band densities were normalized to the β-tubulin content within each sample. The data are expressed as the relative amounts of the two groups. * indicates p <0.05.The data were compared using Student’s t-test.
