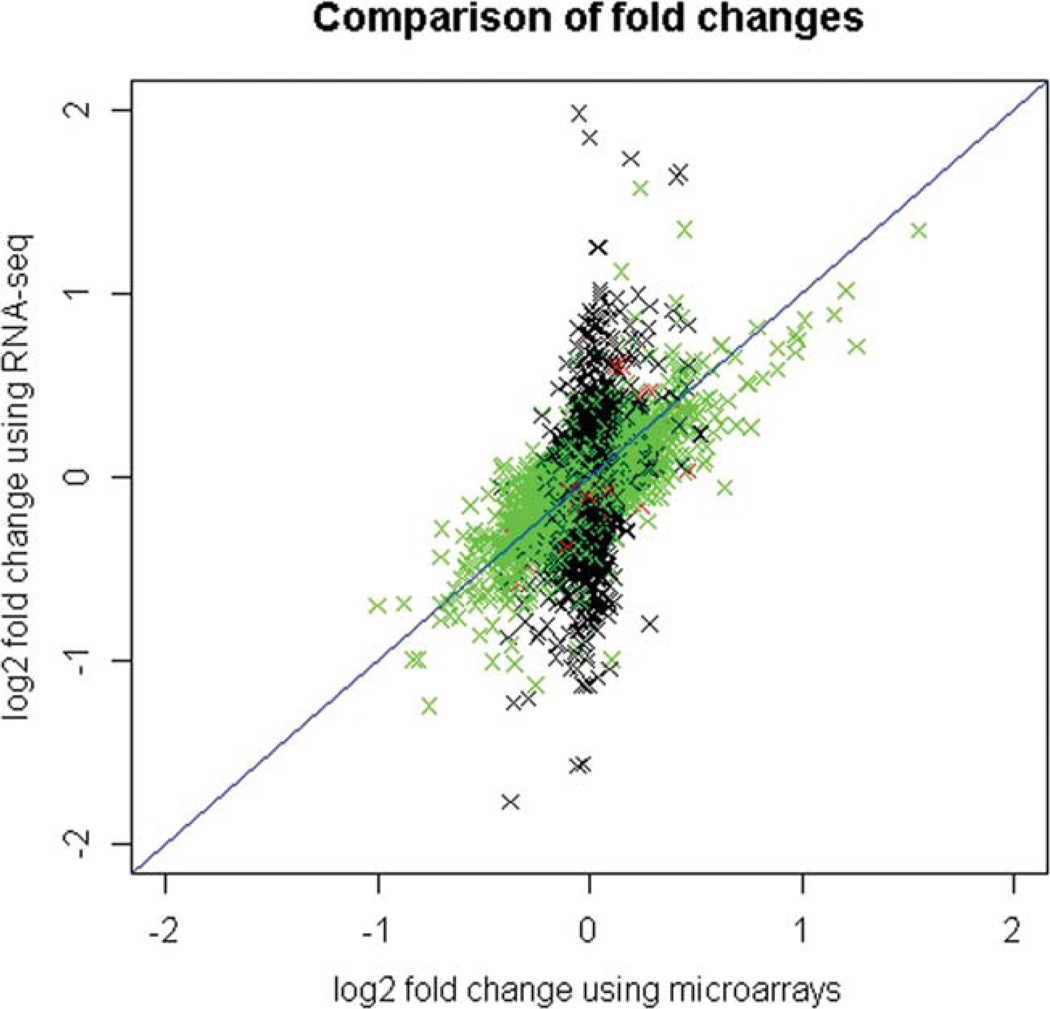
Fig. 3.
Comparison of log-2 transformed estimated fold changes using microarrays and RNA-seq. The points are colored according to the relative mean expression level of the transcript on the microarray platform. The mean log2 expression levels on the microarray ranged from 6.5 to 16. The transcripts with log2 expression levels less than 8 are colored black (low expressed), with expression levels between 8 and 14 are colored green and greater than 14 are colored red (high expressed).

